Cross Column

Showing posts with label Heap Analysis. Show all posts

Sunday, May 31, 2020

How to Setup a Standalone Memory Analyzer for Windows 10

The Eclipse Memory Analyzer is a fast and feature-rich Java heap analyzer that helps you find memory leaks and analyze high memory consumption issues.

Standalone vs Plug-ins


You can install the Memory Analyzer into an Eclipse IDE (see [1]).  However, a standalone Memory Analyzer is useful if you do not want to install a full-fledged IDE on the system you are running the heap analysis.  To download a standalone Memory Analyzer, click here.

Prerequisite


For this illustration, we have downloaded
Eclipse Memory Analyzer Version 1.10.0 ―Windows (x86_64)
which requires a minimum Java version of 1.8.0.

Setups


After unzipping the file, a new folder named mat was created:
C:\Users\<username>\Downloads\mat

You can create a Windows Command Script (.cmd) with the same name in the same folder using the following content:

set PATH=C:\Program Files\Java\jdk-10\bin;
start MemoryAnalyzer.exe

To avoid running MAT with the wrong JRE, we have set its PATH environment variable pointing to a JDK installation with Java version of 18.3.0:

$ cd "/cygdrive/c/Program Files/Java/jdk-10/bin"
$ ./java.exe --version
java 10 2018-03-20
Java(TM) SE Runtime Environment 18.3 (build 10+46)
Java HotSpot(TM) 64-Bit Server VM 18.3 (build 10+46, mixed mode)

To enable MAT handling large heap dumps (i.e., .hprof), you may increase the heap size of MAT runtime by changing its MemoryAnalyzer.ini in the same folder:[7]

-startup
plugins/org.eclipse.equinox.launcher_1.5.0.v20180512-1130.jar
--launcher.library
plugins/org.eclipse.equinox.launcher.win32.win32.x86_64_1.1.700.v20180518-1200
-vmargs
-Xmx10g

For example, we have set its max heap size to be 10 GB.

Getting a Heap Dump


The Memory Analyzer can work with HPROF binary formatted heap dumps. Those heap dumps are written by HotSpot and any VM derived from HotSpot. Depending on your scenario, your OS platform and your JDK version, you may have different options to acquire a heap dump.[2]

As a developer, you want to trigger a heap dump on demand. On Windows, use JDK and JConsole. On Linux and Mac OS X, you can also use jmap or jcmd that comes with JDK.


Via MAT:

Via Java VM parameters:
  • -XX:+HeapDumpOnOutOfMemoryError  –XX:HeapDumpPath=[file path]
    • writes heap dump on the first Out Of Memory Error (recommended)
  • -XX:+HeapDumpOnCtrlBreak 
    • writes heap dump together with thread dump on CTRL+BREAK
    • -XX:+HeapDumpOnCtrlBreak in HotSpot JVM (by Sun/Oracle) is present in 1.4.2_12 or higher and 1.5.0_14 or higher. For JVMs 1.6, 1.7, 1.8 this option is no more present, but you can use the "jmap" or "jcmd" tools.

Via Tools:
  • jmap
    • jmap -dump:format=b,file=snapshot.jmap <process id>
    • It is recommended to use the latest utility jcmd instead of jmap utility for enhanced diagnostics and reduced performance overhead. 
  • jcmd
    • jcmd <process id/main class> GC.heap_dump Myheapdump
  • JConsole
    • Launch jconsole.exe and invoke operation dumpHeap() on HotSpotDiagnostic MBean
  • SAP JVMMon
    • Launch jvmmon.exe and call menu for dumping the heap
Example 1 Create a Heap Dump using jmap

bash-4.2$ ${JAVA_HOME}/bin/jmap -dump:format=b,file=MyJmapHeapdump.hprof 82734
Dumping heap to /tmp/NM_OOM/MyJmapHeapdump.hprof ...
Heap dump file created

Example 2 Create a Heap Dump using jcmd

$ /bi/app/jdk/bin/jcmd 82734 GC.heap_dump MyJcmdHeapdump.hprof
82734:
Heap dump file created

Notes

  • By default, the heap dump will be generated in the "current directory" of the Java application.[6] 
    • jmap generates heap dump in the directory where you run jmap, which is different from jcmd's behavior.
  • The dump file can be huge, up to Gigabytes, so ensure that the target file system has enough space.
  • Need to login as the same user as your process' to attach to it

References

Saturday, January 25, 2014

Eclipse MAT: Understand Incoming and Outgoing References

In [1], we have shown how to use OQL to query String instances starting with a specified substring (i.e., our objects of interest) from a heap dump.[7,8] To determine who is creating these objects, or find out what the purpose of some structures are, an object's incoming and outgoing references become handy.

In this article, we will examine the following topics:
  • What are incoming references or outgoing references of an object?
Then look at three topics related to incoming references:
  • Garbage Collection Roots (GC Roots)
  • Path To GC Roots
  • Immediate Dominators

Outgoing references for the 1st String instance

Outgoing References


Using the following OQL statement, we have identified total 7 entries (see Figure above) as our objects of interest:
SELECT * FROM java.lang.String WHERE toString().startsWith("http://xmlns.oracle.com/apps/fnd/applcore/log/service/types")
After expanding the first entry, it shows two outgoing references:
  1. a reference to the Class instance for the String object
  2. a reference to an array of char values
Outgoing References show the actual contents of the instances, helping to find out their purpose. In our String instance, it holds two references. The memory overhead of this String instance is shown in two values: [3]
  • Shallow Heap
    • Is the memory consumed by that object alone
  • Retained Heap
    • Is the sum of shallow sizes of all objects in the retained set of that object
These sizes of String instances depends on the internal implementation of the JVM. Read [2,4] for more details.

Incoming References


To get incoming references of the first entry, choose List Objects with Incoming References from the context menu.


Now a tree structure is displayed, showing all instances with all incoming references (note the different icon highlighted in red). These references have kept the object alive and prevented it from being garbage collected.  


Incoming references for String object are from QName object whose incoming references are, in turn, from HashMap.Entry object and class WebServiceOperation object.  See [9] for more details.


Immediate Dominators


Similarly, from the context menu, you can display immediate dominators of the first entry (see Figure below). An Object X is said to dominate an Object Y if every path from the GC Root to Y must pass through X. So, immediate dominators is a very effective way to find out who is keeping a set of objects alive. For example, the immediate dominators of our first String entry in the OQL query (note that we have used "java.*|com\.sun\..*" as our filter) is:

  • oracle.j2ee.ws.server.deployment.WebServiceEndpoint

The immediate donimator of String instance is WebServieEndpoint instance

Garbage Collection Roots (GC Roots)


GC roots are objects accessible from outside the heap. GC algorithms build a tree of live objects starting from these GC roots.

The below list shows some of the GC roots: [9,10]
  • System Class
  • Thread Block
    • Objects referred to from currently active thread blocks
    • Basically all objects in active thread blocks when a GC is happening are GC roots
  • Thread
    • Active Threads
  • Java Local
    • All local variables (parameters, objects or methods in thread stacks)
  • JNI Local
    • Local variable or parameter of JNI method
  • JNI Global
    • Global JNI reference
  • Monitor Used
    • Objects used as a monitor for synchronization

Path To GC Roots


From context menu, you can also show "Path to GC Roots" of the first entry (see Figure below). Path to GC Roots shows the path to GC roots which should be found for a given object. As you can expect, its immediate dominators must also be on this path. Note that, when you display Path to GC Roots, you can specify which fields of certain classes to be ignored when finding paths. For example, we have specified that paths through Weak or Soft Reference referents to be excluded.

GC root of instance of class String is the HashMap.Entry

Live Data Set


Now we know
  • oracle.j2ee.ws.server.deployment.WebServiceEndpoint
is keeping our String instance alive. Instead of viewing Path to GC Roots, it is easier to see it the other way around. So, we have chosen to display the outgoing references of WebServiceEndpoint instance (see Figure below). As you can see, our String instance is displayed as the leaf node of the tree structure.


References

  1. Eclipse MAT: Querying Heap Objects Using OQL (Xml and More)
  2. Java memory usage of simple data structure
  3. Shallow vs. Retained Heap
  4. Create and Understand Java Heapdumps (Act 4)
  5. Diagnosing Java.lang.OutOfMemoryError (Xml and More)
  6. I Bet You Have a Memory Leak in Your Application by Nikita Salnikov-Tarnovski
    • Classloader leak is the most common leak in web applications
  7. How to analyze heap dumps
    • Leak can be induced
      • Per call (or a class of objects)
      • Per object 
  8. Diagnosing Heap Stress in HotSpot (Xml and More)
  9. Basic Concepts of Java Heap Dump Analysis with MAT (good)
  10. What are the GC roots?

Tuesday, January 14, 2014

Eclipse MAT: Querying Heap Objects Using OQL

This article is a follow-up of [1]. Here we continue to explore on how to investigate memory leaks of an application using Memory Analyzer.[2]


Querying Heap Objects (OQL)


Memory Analyzer allows you to query the heap dump[3] with custom SQL-like queries (OQL). OQL represents classes as tables, objects as rows, and fields as columns:[4]

SELECT *
FROM [ INSTANCEOF ] <class name="name">
[ WHERE <filter-expression> ]
</filter-expression></class>To open an OQL editor use the toolbar button :

For instance, we have used the following SQL statement:
select * from java.lang.String where toString().startsWith("http://xmlns.oracle.com/bpel")

to query String objects with a certain prefix (i.e., "http://xmlns.oracle.com/bpel") and calculate the total size of retained heap associated with the interested objects.  Note that you need to press red "!" button to execute the OQL.


Shallow vs. Retained Heap


As shown in the Figure, two sizes of an object are displayed in the Result area:
  • Shallow heap
  • Retained heap

Generally speaking, shallow heap of an object is its size in the heap and retained size of the same object is the amount of heap memory that will be freed when the object is garbage collected. In other words, retained heap of object X is the sum of shallow sizes of all objects in the retained set of X, the set of objects which would be removed by Garbage Collector when X is garbage collected.

As said in [6], while Shallow Heap can be interesting, the more useful metric is the Retained Heap. For example, you can benchmark retained sizes of interested objects before and after your code optimizations. Below, we will show how to compute the total retained size of our interested objects.


Exporting to CSV...


Analyzed data can be exported from the heap editor by:[5]
  • Using the toolbar export menu (you can choose between export to HTML, CSV, and TXT)

Let's say we have exported it to a CSV file named RetainedHeap.txt.

Importing CSV File into Excel


You can use Java code to parse the CSV file and compute the retained heap of interested objects. An alternative way is using Excel, which is demonstrated here.

First, you open RetainedHeap.txt and specify both comma and space as the delimiters of fields.


Then, select all "Retained Heap" fields (shown in red) and compute the Sum as shown below:


Finding Responsible Objects


To investigate your potential memory leaks, it will be important to answer the following question:
Who has kept these objects alive?
To answer that, you can use Immediate Dominators (an Object X is said to dominate an Object Y if every path from the Root to Y must pass through X) from the context menu. This query finds and aggregates all objects dominating a given set of objects on class level. It is very useful to quickly find out who is responsible for a set of objects. Using the fact that every object has just one immediate dominator (unlike multiple incoming references) the tool offers possibility to filter "uninteresting" dominators (e.g. java.* classes) and directly see the responsible application classes.

For example, if your interested objects are char arrays. The immediate dominators of all char arrays are all objects responsible for keeping the char[] alive. The result will contain most likely java.lang.String objects. If you add the skip pattern java.* , and you will see the non-JDK classes responsible for the char arrays.


Bonus OQL Example


In the above OQL example, it shows that two columns were selected:
  • toString(s.sqlObject.actualSql)
  • s.@retainedHeapSize
from oracle.jdbc.driver.T4CPreparedStatement (alias: s).  Also, a filter was added (highlighted in red):
  • .*SELECT TerritoryResource.*

Saturday, August 10, 2013

Diagnosing Heap Stress in HotSpot

Heap stress is characterized as OutOfMemory conditions or frequent Full GCs accounting for a certain percentage of CPU time[6].  To diagnose heap stress, either heap dumps or heap histograms can help.

In this article, we will discuss the following topics:
  1. Heap histogram vs. heap dump[1]
  2. How to generate heap histogram or heap dump in HotSpot


Heap Histogram vs. Heap Dump 


Without much ado, read this companion article for the comparison.  For heap analysis, you can use either jmap or jcmd to do the job[5].  Here we focus only on using jmap.

$ jdk-hs/bin/jmap -help
Usage:
    jmap [option] 
        (to connect to running process)
    jmap [option] 
        (to connect to a core file)
    jmap [option] [server_id@]
        (to connect to remote debug server)

where <option> is one of:
    <none>               to print same info as Solaris pmap
    -heap                to print java heap summary
    -histo[:live]        to print histogram of java object heap; if the "live"
                         suboption is specified, only count live objects
    -permstat            to print permanent generation statistics
    -finalizerinfo       to print information on objects awaiting finalization
    -dump:<dump-options> to dump java heap in hprof binary format
                         dump-options:
                           live         dump only live objects; if not specified,
                                        all objects in the heap are dumped.
                           format=b     binary format
                           file=  dump heap to 
                         Example: jmap -dump:live,format=b,file=heap.bin <pid>
    -F                   force. Use with -dump:<dump-options> <pid> or -histo
                         to force a heap dump or histogram when <pid> does not
                         respond. The "live" suboption is not supported
                         in this mode.
    -h | -help           to print this help message
    -J<flag>             to pass <flag> directly to the runtime system


Generating Heap Histogram


Heap histograms can be obtained by using jmap (note that you need to use jmap from the same JDK installation which is used to run your applications):

$~/JVMs/jdk-hs/bin/jmap -histo:live 7891 >hs_jmap_7891.txt


 num     #instances         #bytes  class name
----------------------------------------------
   1:       2099805      195645632  [C
   2:        347553       49534472  <constMethodKlass>
   3:       2055692       49336608  java.lang.String
   4:        347553       44501600  <methodKlass>
   5:         30089       36612792  <constantPoolKlass>
   6:       1044560       33425920  java.util.HashMap$Entry
   7:         90868       24909264  [B
   8:         30089       23289072  <instanceKlassKlass>
   9:         22323       18194144  <constantPoolCacheKlass>
  10:        177458       15661816  [Ljava.util.HashMap$Entry;
  11:        642260       15414240  javax.management.ObjectName$Property
  12:        159785       15405144  [Ljava.lang.Object;

In the output, it shows the total size and instance count for each class type in the heap.  For example, there are 2099805 instances of character arrays (i..e, [C), which has a total size of 195645632 bytes.  Because the suboption live was specified, only live objects were counted (i.e., a full GC was forced before histogram was collected).

Generating Heap Dump


Heap dump is a file containing all the memory contents of a Java application. It can be generated via:

$ ~/JVMs/jdk-hs/bin/jmap -dump:live,file=/tmp/hs_jmap_dump.hprof 7891
Dumping heap to /tmp/hs_jmap_dump.hprof ...
Heap dump file created

Including the live option in jmap will force a full GC to occur before the heap is dumped so that it contains only live objects.  We recommend taking multiple heap dumps.  For example, 30 minutes and 1 hour into the run.  Then use Eclipse MAT[2,3] to examine the heap dumps.

Finally, there are other ways to generate a java heap dump:
  • Use jconsole option to obtain a heap dump via HotSpotDiagnosticMXBean at runtime
  • Heap dump will be generated when OutOfMemoryError is thrown by specifying
    • -XX:+HeapDumpOnOutOfMemoryError VM option
  • Use hprof[7]


References

Wednesday, August 7, 2013

Diagnosing OutOfMemoryError or Memory Leaks in JRockit

When you run into OutOfMemoryError or other memory-leak issues, generating a heap histogram or heap dump can help you diagnose the memory-bloating issues.

In [1], it lists the following Java Heap related problems:
  • Exceeding max heap 
    • The heap is full and cannot fit a new object
  • Large allocation
    • The new object is too large for the contiguous free space
  • Native exhaustion
    • There is not enough native heap for the requested object[10]
  • GC Starvation
    • The heap is almost full and causing frequent garbage collection[9]
  • Optimization
    • Heap utilization is higher than expected for the current number of users
In this article, we will discuss the following topics:
  1. Heap histogram vs. heap dump (see also [8])
  2. How to generate heap histogram or heap dump in JRockit
  3. JVM options that are useful for heap analysis

Heap Histogram vs. Heap Dump


A heap dump is a snapshot of all the objects in the Java Virtual Machine (JVM) heap at a certain point in time. The JVM software allocates memory for objects from the heap for all class instances and arrays. The garbage collector reclaims the heap memory when an object is no longer needed and there are no references to the object. By examining the heap you can locate where objects are created and find the references to those objects in the source.  However, dumping of Java heap is time-consuming and lengthy in size.

On the other hand, heap histogram gives a very good summary of heap objects used in the application without doing a full heap dump. It can help you quickly narrow down a memory leak. This information can be obtained in several way:
  • Attach a running process using the command jrcmd.
  • Generate from a core file or heap dump
Note that we refer to heap histogram, heap summary, or heap diagnostics interchangeably in this article.

Generating Heap Histogram


A heap histogram can be obtained from a running process using the command:
  • jrcmd 20488 heap_diagnostics


--------- Detailed Heap Statistics: ---------
30.0% 65027k   672176     -1k [C
10.2% 22119k   943754     -2k java/lang/String
10.0% 21592k   183036     -3k [Ljava/lang/Object;
 4.7% 10185k   434587     +0k java/util/HashMap$Entry
 4.7% 10114k    27029  -1254k [B
 4.5% 9783k   111539     +0k [Ljava/util/HashMap$Entry;
 1.9% 4075k    34777     +0k java/lang/Class
 1.9% 4058k    86590     +0k java/util/HashMap
 1.6% 3448k   147156     +0k javax/management/ObjectName$Property
 1.2% 2593k    82994     +0k java/util/LinkedHashMap$Entry
 1.1% 2398k    76765     +0k java/util/concurrent/ConcurrentHashMap$Segment
 1.0% 2215k     9311     +0k [I
 0.9% 1975k    18469     +0k [J

In the output, there is a "Detailed Heap Statistics" section, which shows the total size and instance count for each class type in the heap:
  • The first column corresponds to the Class object type contribution to the Java Heap footprint in %
  • The second column correponds to the Class object type memory footprint in K
  • The third column correponds to the # of Class instances of a particular type
  • The fourth column correponds to the delta - / + memory footprint of a particular type
As you can see from the above snapshot, the biggest data type is [C (i.e., character array) and java.lang.String. In order to see which data types are leaking, you will probably need to generate several snapshots, which you might be able to observe a trend that can lead to further analysis.

Generating Heap Dump


Heap dump is a file containing all the memory contents of a Java application. It can be generated via 
  • jrcmd 20488 hprofdump
    • Wrote dump to /.../appmgr/APPTOP/instance/debug/jrockit_20488.hprof
Then you can use various tools to load that file and look at various things in the heap: how much each kind of object is using, what things are holding onto the most amount of memory, and so on.  The size of heap dump file is proportional to the size of Java Heap and can be large.

Three of the most common tools are:

  • jhat
    • This is the original heap analyzer tool, which reads the heap dump and runs a small HTTP server that lets you look at the dump through a series of web page links.
  • VisualVM [3]
  • MAT [4,5]

Heap-Related JVM Options


When your JVM runs into OutOfMemoryError, you can set:
  • -XX:+HeapDumpOnOutOfMemoryError
to get a heap dump after the heap is big and bloated just before the JVM dies.  Also, you can provide the following flags:
  • -XX:HeapDumpPath=<path to the destination>
  • -XX:+ExitOnOutOfMemoryError
Similarly, you can get a heap histogram instead of a full heap dump using[7]:
  • -XX:+HeapDiagnosticsOnOutOfMemoryError 
  • -XX:HeapDiagnosticsPath=<path to the destination>

Sunday, May 15, 2011

Diagnosing Java.lang.OutOfMemoryError

The heap is one of the foremost components that should be monitored to trace performance issues[18, 19,22]. Heap pressure is created when the heap usage approaches the maximum heap size permitted. This leads to frequent full garbage collection events. This steals CPU cycles available for processing and the overall response times degrade. Extreme cases can lead to OutOfMemory conditions, which are not recoverable without a JVM restart.

OutOfMemoryError

When I ran my application, the following exceptions have been thrown in sequence:
  • java.lang.OutOfMemoryError: GC overhead limit exceeded[7,9,15]
  • java.lang.OutOfMemoryError: Java heap space
The first message means that, for some reason, the garbage collector is taking an excessive amount of time and recovers very little memory in each run. After I removed the following statement:
  • System.gc();
The 1st message was gone. However, the system threw the 2nd message. So, obviously my heap space issue remains. Here are the steps that I took to investigate it:
  1. Add the following Java Options
    • -Xloggc:gc.log -XX:+PrintGCDetails -XX:+PrintGCTimeStamps
      • System will generate a gc.log file
    • -XX:+HeapDumpOnOutOfMemoryError
      • System will generate a heap dump file
      • There is an additional HotSpot VM command line option that allows a user to specify a path where the heap dump will be placed
        • -XX:HeapDumpPath=
  2. Analyze the log files:
    • Use regular text editor to examine gc.log file
    • Use Eclipse Memory Analyzer to examine heap dump file (i.e., java_xxx.hprof)
    Sometimes your Java process could have run into  "GC overhead limit exceeded" and remain alive.  In this case, you may gather extra information using jstat:
    jstat -gcutil
    jstat -gccapacity
    without restarting the Java process.  Note that all command options discussed in this article applied to Hotspot VM.

    JVM Options

    The command line options specify:
    • -XX:+PrintGCDetails
      • prints more details at garbage collection.
    • -XX:+PrintGCTimeStamps
      • prints a time stamp representing the number of seconds since the HotSpot VM was launched until the garbage collection occurred.
    • -Xloggc:gc.log
      • causes information about the heap and garbage collection to be printed at each collection.

    To set Java Options in JDeveloper, do the following:
    1. Right select your project (i.e., ViewController) and bring up the context menu
    2. Select Project Properties...
    3. Select Run/Debug/Profile
    4. Select your Run Configuration (i.e., Default)
    5. Click Edit button
    6. Specify -Xloggc:gc.log -XX:-PrintGCDetails in the Java Options field
    Run your application and reproduce the out-of-memory exception. A log file named gc.log will be generated. I've found mine in the following default location:
    • .../system11.1.1.5.37.60.13/DefaultDomain
    because my web application was deployed to the Integrated WLS[4] and run from DefaultDomain. To understand the format of gc.log, read [5,15] for details.

    However, gc.log file was not really helpful because it simply pointed out there was a heap issue. But, it didn't say where.

    The next step I have taken is running my server with the following flag:

    -XX:+HeapDumpOnOutOfMemoryError

    it generated a java_pid30835.hprof file when my server encountered a heap error.

    Eclipse Memory Analyzer

    The heap dump file (i.e., java_pid30835.hprof) is generated by HPROF—a heap and cpu profiling tool. My heap dump file was generated in binary format. Therefore I need to use Eclpse Memory Analyzer to examine it.

    You can install Eclipse MAT via the Eclipse Update manager . Select "General Purpose Tools " and install "Memory Analyser (Incubation)" and "Memory Analyser (Charts)".
    After installation, double-click your heap dump file and select "Leak Suspects Report".
    Eclipse MAT will show a diagram:
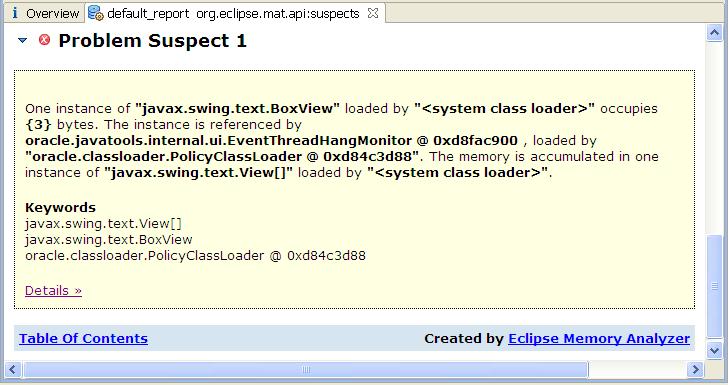
    and problem suspects:
    You can click on the "Details" link to investigate.

    Heap Size Adjustment

    If you observe many full GCs, try to determine if your old generation is sized too small to hold all the live objects collected from the Survivor and Eden spaces. Alternatively, there may be too many live objects that do not fit into the configured heap size. If it is the latter, increase the overall heap size.

    Based on whether the old generation space or the permanent generation space is running out of memory, you may adjust the sizes of heap and meta spaces in this way[10]:
    • For old generation space OutOfMemoryErrors
      • Increase -Xms and -Xmx
    • For permanent generation OutOfMemoryErrors
      • Increase -XX:PermSize and -XX:MaxPermSize

    References
    1. Eclipse Update Manager
    2. Eclipse Memory Analyzer
    3. Java Hotspot VM Options
    4. Integrated WebLogic Server (WLS)
    5. Diagnosing a Garbage Collection problem
    6. Frequently Asked Questions about Garbage Collection
    7. GC Overhead Limit Exceeded
    8. HPROF: A Heap/CPU Profiling Tool in J2SE 5.0
    9. Java SE 6 HotSpot[tm] Virtual Machine Garbage Collection Tuning
    10. Java Performance by Charlie Hunt and Binu John
    11. Understanding Garbage Collection
    12. Java HotSpot VM Options
    13. GCViewer (a free open source tool)
    14. Understanding Garbage Collector Output of Hotspot VM
    15. A Case Study of java.lang.OutOfMemoryError: GC overhead limit exceeded
    16. Memory Analyzer Downloads
      • The stand-alone Memory Analyzer is based on Eclipse RCP.
      • Can find the update site here too.
    17. Shallow vs. Retained Heap (MAT)
    18. Diagnosing Heap Stress in HotSpot (XML and More)
    19. Diagnosing OutOfMemoryError or Memory Leaks in JRockit (XML and More)
    20. MAT Documentation
    21. Out of Memory Error while Running the Memory Analyzer
      • I need to modify -Xmx512m to -Xmx4g in the file eclipse.ini to analyze a 2GB hprof file.
    22. Eclipse MAT: Querying Heap Objects Using OQL (Xml and More)
    23. Eclipse MAT: Understand Incoming and Outgoing References  (Xml and More)
    24. Memory Mapped File and IO in Java
      • Memory used to load Memory mapped file is outside of Java heap Space.  If OOM is caused by memory-mapped files, you may want to reduce your Java heap allocation (i.e., reducing -Xmx).
        • java.io.IOException: Map failed
    25. jstat - Java Virtual Machine Statistics Monitoring Tool (XML and More)
    26. Eclipse MAT — Incoming, Outgoing References (good)

    © Travel for Life Guide. All Rights Reserved.

    Analytical Insights on Health, Culture, and Security.