Cross Column

Showing posts with label WebLogic Server. Show all posts

Thursday, April 26, 2018

How to Debug "java.io.IOException: Connection reset by peer"?


There are many reasons that WebLogic server may throw below exception:
java.io.IOException: Connection reset by peer
In this article, we will use one specific case for discussion.

Stack Trace


####<Apr 26, 2018, 8:42:37,381 AM UTC> <Error> <HTTP> <myserver> <CloudConsoleServer_MyServices> <[ACTIVE] ExecuteThread: '23' for queue: 'weblogic.kernel.Default (self-tuning)'> <<WLS Kernel>> <> <XaUWE0Co100000000> <1524732157381> <[severity-value: 8] [rid: 0:1:2] [partition-id: 0] [partition-name: DOMAIN] > <BEA-101019> <[ServletContext@15863685[app:cp-myservices.ear module:mycloud path:null spec-version:3.1 version:_18.2.4.0.0_180422.1400]] Servlet failed with an IOException.
java.io.IOException: Connection reset by peer
        at sun.nio.ch.FileDispatcherImpl.write0(Native Method)
        at sun.nio.ch.SocketDispatcher.write(SocketDispatcher.java:47)
        at sun.nio.ch.IOUtil.writeFromNativeBuffer(IOUtil.java:93)
        at sun.nio.ch.IOUtil.write(IOUtil.java:65)
        at sun.nio.ch.SocketChannelImpl.write(SocketChannelImpl.java:471)
        at weblogic.socket.NIOOutputStream$SingleBufferWrite.writeTo(NIOOutputStream.java:841)
        at weblogic.socket.NIOOutputStream$BlockingWriter.flush(NIOOutputStream.java:455)
        at weblogic.socket.NIOOutputStream$BlockingWriter.write(NIOOutputStream.java:334)
        at weblogic.socket.NIOOutputStream.write(NIOOutputStream.java:220)
        at weblogic.servlet.internal.ChunkOutput.writeChunkTransfer(ChunkOutput.java:625)
        at weblogic.servlet.internal.ChunkOutput.writeChunks(ChunkOutput.java:587)
        at weblogic.servlet.internal.ChunkOutput.flush(ChunkOutput.java:471)
        at weblogic.servlet.internal.ChunkOutput$3.checkForFlush(ChunkOutput.java:757)
        at weblogic.servlet.internal.ChunkOutput.write(ChunkOutput.java:373)
        at weblogic.servlet.internal.ChunkOutputWrapper.write(ChunkOutputWrapper.java:165)
        at weblogic.servlet.internal.ServletOutputStreamImpl.write(ServletOutputStreamImpl.java:186)
        at java.io.ByteArrayOutputStream.writeTo(ByteArrayOutputStream.java:167)
        at oracle.adfinternal.view.faces.caching.filter.ResponseOutputStream.writeContentTo(ResponseOutputStream.java:74)
        at oracle.adfinternal.view.faces.caching.filter.AdfFacesCachingResponse._flushContent(AdfFacesCachingResponse.java:147)
        at oracle.adfinternal.view.faces.caching.filter.AdfFacesCachingResponse.flush(AdfFacesCachingResponse.java:136)

How to Debug


In this case, our server is connected to many applications in other servers. So, the peer-in-suspect could be from either a browser or an application running in our infrastructure.

Given the stack trace, the first thing to check is find some clues from it.  For example, in this case, we saw:

 weblogic.servlet.internal.ServletOutputStreamImpl.write(ServletOutputStreamImpl.java:186)
 java.io.ByteArrayOutputStream.writeTo(ByteArrayOutputStream.java:167)
 oracle.adfinternal.view.faces.caching.filter.ResponseOutputStream.writeContentTo(ResponseOutputStream.java:74)
 oracle.adfinternal.view.faces.caching.filter.AdfFacesCachingResponse._flushContent(AdfFacesCachingResponse.java:147)
 oracle.adfinternal.view.faces.caching.filter.AdfFacesCachingResponse.flush(AdfFacesCachingResponse.java:136)


which means that WebLogic server is 
Writing the servlet response back to the client when the IOException was thrown

If this client were a browser, what happened could be:
The browser has shutdown the connection — either the browser crashed, or the browser shut the connection explicitly because the user closed that page or cancelled navigation on that page.

If this client were an application (i.e., a selenium or other testing tools), what happened could be:
Timeouts in those tools for how long they will wait for the response.
then
Maybe their logs would show you that they had closed the socket after some time.


HTTP Keep-Alive


In [1], the author surmized that it could be:
 " Very likely an issue with HTTP keepalive (persistent connections)."
However, this is not our case because:
Keep-alive is to make sure the socket stays open between requests. Our case is in the middle of a request, so there is no keepalive in use at that time. But conceptually it is sort of the same thing: if the client (i.e., browser) decides that the response isn't coming, it closes the socket.

If You Find Out Who's the Peer


Let assume the client is another Linux application, here are possible debugging steps:
The only thing to check at the system level is that if the machine was up the entire time — you can check its uptime, and look at dmesg for messages about the link going up or down. Otherwise, maybe the application logs will tell you if the process restarted/crashed, which is the more likely cause. 

Could tcpdump help in this case?  Probably not  because
There will probably be too much data from a tcpdump unless you know how to filter what you are looking for. 


References

  1. Possible Causes for "Connection reset by peer" when using NIOReferences

Thursday, November 27, 2014

WebLogic: Important Deployment Concepts

WebLogic Server implements the Java EE 5 specification. Java EE 5 includes a deployment specification, JSR-88,[1] that describes a standard API used by deployment tools and application server providers to configure and deploy applications to an application server.

Although the Java EE 5 deployment API provides a simple, standardized way to configure applications and modules for use with a Java EE 5-compliant application server, the specification does not address many deployment features that were available in previous WebLogic Server releases. For this reason, WebLogic Server provides important extensions to the Java EE 5 deployment API specification to support capabilities described in [2].

In this article, we will discuss some important concepts for understanding the deployment process in WebLogic Server.


Deployment Tools


The term application deployment refers to the process of making an application or module available for processing client requests in a WebLogic Server domain.  You have several options to deploy a web application onto WebLogic Server:
  • weblogic.Deployer
    • A packaged deployment tool which provides deployment services for WebLogic Server. 
    • Any deployment operation that can be implemented using the WebLogic Deployment API[19] is implemented, either in part or in full, by weblogic.Deployer.
    • weblogic.Deployer is the recommended deployment tool for the WebLogic Server environment. 
  • WLDeploy
  • WLST[4,5,20]
    • WLST functionality includes the capabilities of the following WebLogic Server command-line utilities:
      • weblogic.Deployer
      • WLDeploy
  • JSR-88 API for deployment
    • WebLogic Deployment API,[19] which implements and extends the Java EE Deployment API specification (JSR-88)
    • The WebLogic Deployment API[19] classes and interfaces extend and implement the Java EE Deployment API specification (JSR-88) interfaces, which are described in the javax.enterprise.deploy sub-packages.[6]
  • JMX Deployment API[7]
    • Supports all of the common functionality available in the Java EE Deployment API specification (JSR-88). 
    • You can use the JMX API as an alternative to JSR-88 to perform deployment tasks on specified target servers
  • WLS console (through JSR-88 API)[8]
  • FMWC (through JSR-88 API and JMX Deployment API)[9]


Deployment Concepts


To help you understand the deployment process in WebLogic Server, we have listed the most important concepts below:
  • Deployable objects (or artifacts)
    • Which can be deployed on a weblogic domain
      • EJBs
      • Modules
        • Supported module types include:[11,12]
          • JMS, JDBC, Interception, Config, and WLDF[10]
      • Web Services
      • Applications[13]
    • Physical package types:
      •  EARs, standalone J2EE and non-J2EE modules
  • Deployment operations (or tasks)
    • Such as distributing, starting, stopping, deploying, redeploying, undeploying, etc.
      • deploying
        • if successful, an AppDeploymentMBean[14] for the application will be created 
  • Deployment targets
    • Target types available to WebLogic Server include:
      • Cluster
      • JMS Server
      • SAF Agent
      • Server
      • Virtual host 
  • Deployment order
    • An integer value that indicates when this artifact is deployed, relative to other deployable artifacts on a server, during startup.
    • Artifacts with lower values are deployed before those with higher values.
  • Deployment plan
    • You can use either Weblogic Console or weblogic.PlanGenerator to export portions of a WebLogic Server deployment configuration into a deployment plan file.[16,17]
    • Describes the application structure, identifies all deployment descriptors, and exports a subset of the application's configurable properties.  For example, it includes:
      • Resource dependencies
      • Resource declarations
      • Non-resource oriented configurable properties
      • Properties that may be changed in a running application, etc
    • A deployment plan is an XML document used to define an application's deployment configuration for a specific WebLogic Server environment, such as development, test, or production. 
    • A deployment plan resides outside of an application's archive file and contains deployment properties that override an application's existing Java Enterprise Edition and WebLogic Server deployment descriptors. 
    • Use deployment plans to easily change an application's WebLogic Server configuration for a specific environment, without modifying existing deployment descriptors.
  • Deployment configuration
    • Refers to the process of preparing an application or deployable resource for deployment to a WebLogic Server instance.
    • Modification of individual WebLogic Server configuration values based on user inputs and the selected WebLogic Server targets
  • Deployment staging
    • The staging mode of an application or deployment plan can be provided to affect its deployment behavior.
      • An application's deployment plan can be staged independently of the application archive, allowing you to stage a deployment plan when the application is not staged.
      • If you do not specify a staging mode, the deployment plan uses the value specified for application staging as the default.
    • Staging mode includes:
      • STAGE—Application files (or deployment plans) are copied to target servers
      • NO_STAGE—Application files (or deployment plans) are not copied to target servers
      • EXTERNAL_STAGE—Application files (or deployment plans) are copied manually to target servers

"Install Root" Abstraction


The SessionHelper[18] in WebLogic Deployment API[19] views an application and deployment plan artifacts using an "install root" abstraction, which ideally is the actual organization of the application. The install root appears as follows:

install-root (eg myapp) 
-- app 
----- archive (eg myapp.ear) 
-- plan
----- deployment plan (eg plan.xml) 
----- external descriptors (eg META-INF/weblogic-application.xml...) 

Optionally, you may consider using this layout to organize your applications and deployment plans.

References

  1. JSR 88: JavaTM EE Application Deployment
  2. WebLogic Server Deployment Features
  3. Understanding the WebLogic Deployment API (WebLogic 12.1.2)
  4. WLST FAQs
  5. WLST Command and Variable Reference
  6. Java EE 5 API Summary
  7. The JMX API for Deployment Operations
  8. Administration Console Online Help
  9. Using Fusion Middleware Control to Manage WebLogic Server
  10. The Configuration File in WebLogic Server Domain — config.xml (Xml and More)
  11. Module Types
  12. Example Module Deployment
  13. Oracle® Fusion Middleware Deploying Applications to Oracle WebLogic Server
  14. Interface AppDeploymentMBean
  15. MBean Reference for Oracle WebLogic Server
  16. Create a deployment plan using Administration Console
  17. Oracle WebLogic Server 12c: Creating and Using a Deployment Plan
  18. SessionHelper
  19. WebLogic Deployment API
  20. WLST: deploy command (WLS 12.1.2)
  21. Pack and Unpack Commands
    • Provide a simple, one-step method for creating WebLogic domains and templates from the command line.
    • You cannot, however, use these commands to customize the contents of your WebLogic domain or template in the same way as with the other tools (i.e., Configuration Wizard or WLST).
  22. Deployment Tools for Developers (WLS 12.1.1)

Thursday, September 26, 2013

WebLogic Startup Slowness Caused by Kernel's Random Number Generator

Java Application (i.e., WebLogic Server) could be slow at startup time and it could be caused by the slowness of random number generator used by the application.  You can read [2] for the case that discusses the slowness of WebLogic startup.

In this article, we will examine the following issues:
  • /dev/random vs. /dev/urandom
    • How to test the performance of a random number generator?
    • How to configure it?
  • Security considerations
on Linux systems.  Note that this can happen with WLS running on AIX too.

/dev/random vs. /dev/urandom


Without much ado, here is the man output for "urandom":
The character special files /dev/random and /dev/urandom (present since Linux 1.3.30) provide an interface to the kernel's random number generator.  File /dev/random has major device number 1 and minor device number 8.  File /dev/urandom has major device number 1  and  minor  device number 9.
The  random  number  generator  gathers environmental noise from device drivers and other sources into an entropy  pool.   The  generator  also keeps  an  estimate of the number of bits of noise in the entropy pool.  From this entropy pool random numbers are created. 
When read, the /dev/random device will only return random bytes  within the estimated number of bits of noise in the entropy pool.  /dev/random should be suitable for uses that need very high quality randomness such as  one-time  pad  or  key generation.  When the entropy pool is empty, reads from /dev/random will block until additional environmental  noise is gathered. 
A  read  from  the  /dev/urandom device will not block waiting for more entropy.  As a result, if  there  is  not  sufficient  entropy  in  the entropy  pool,  the  returned  values are theoretically vulnerable to a cryptographic attack on the algorithms used by the  driver.   Knowledge of how to do this is not available in the current non-classified literature, but it is theoretically possible that such an attack may  exist.  If this is a concern in your application, use /dev/random instead.

How to Test?


You can use "time" command to measure the performance of each random number generator.  For example, here is the output from the Linux system.

$time head -1 /dev/random                                                  
real    0m9.718s
user    0m0.000s
sys     0m0.001s


$ time head -1 /dev/./urandom
real    0m0.002s
user    0m0.000s
sys     0m0.002s

As you can see that "/dev/urandom" is much faster because it's non-blocking.  However, /dev/random will block until additional environmental noise is gathered and takes longer time to return.

How to Configure?


You can configure which source of seed data for SecureRandom to use at JVM level or at WLS' command-line level.

At the JVM level, you can change the value of securerandom.source property in the file:
  • $JAVA_HOME/jre/lib/security/java.security
Here is the description of securerandom.source property:

# Select the source of seed data for SecureRandom. By default an
# attempt is made to use the entropy gathering device specified by
# the securerandom.source property. If an exception occurs when
# accessing the URL then the traditional system/thread activity
# algorithm is used.
#
# On Solaris and Linux systems, if file:/dev/urandom is specified and it
# exists, a special SecureRandom implementation is activated by default.
# This "NativePRNG" reads random bytes directly from /dev/urandom.
#
# On Windows systems, the URLs file:/dev/random and file:/dev/urandom
# enables use of the Microsoft CryptoAPI seed functionality.
#
securerandom.source=file:/dev/urandom

Or, you can specify which source of seed data to use by adding
  • -Djava.security.egd=file:/dev/./urandom
to the java command-line that starts WebLogic Server.

Security Considerations


In [1], it warns that if you choose /dev/urandom over /dev/random for better performance, you should be aware of that:
This workaround should not be used in production environments because it uses pseudo-random numbers instead of genuine random numbers.


References

  1. Random Number Generator May Be Slow on Machines With Inadequate Entropy
  2. Weblogic starts slow
  3. Fusion Middleware Performance and Tuning for Oracle WebLogic Server
  4. Oracle® Fusion Middleware Tuning Performance of Oracle WebLogic Server 12c (12.2.1)
  5. Fusion Middleware Tuning Performance of Oracle WebLogic Server (12.2.1.3.0)

Wednesday, October 3, 2012

Monitoring WebLogic JDBC Connection Pool at Runtime

Before you start any performance tuning, you need to monitor your application runtime behavior using default application server settings first.

In this article, we will show you how to monitor the health of WebLogic JDBC connection pool. In a companion article[7], we also show you how to tune Prepared Statement Cache in WebLogic Server for better web application performance.

Data Sources & JDBC Connection Pool


WebLogic Server maintains a pool of reusable physical database connections to minimize the overhead involved in connecting to a database. All the connections in a pool connect to the same database and use the same username and password for the connections.

WebLogic Server also manage your database connectivity through JDBC data sources. WebLogic Server data sources help separate database connection information from your application code.  Each data source that you configure contains a pool of database connections that are created when the data source instance is created—when it is deployed or targeted, or at server startup. The connection pool can grow or shrink dynamically to accommodate the demand.

At runtime, Java applications perform a lookup of the JNDI tree to find the data source and request database connections using the getConnectionMethod. Once the application completes using that connection, the connection goes back to the data source’s connection pool.

DataSource Runtime Monitoring


Using WebLogic Server Administration Console, you can monitor JDBC DataSource statistics by navigating to:
  • Servers --> SalesServer_1 --> Monitoring --> JDBC

There are many KPIs that you can monitor with and you can customize which ones to be displayed in the table.  We have listed some important KPIs here:
  • Waiting For Connection High Count
    • Highest number of application requests concurrently waiting for a connection from this instance of the data source
  • Wait Seconds High Count
    • The highest number of seconds that an application waited for a connection (the longest connection reserve wait time) from this instance of the connection pool since the connection pool was instantiated
  • Connection Delay Time
    • The average amount of time, in milliseconds, that it takes to create a physical connection to the database
    • The value is calculated as summary of all times to connect divided by the total number of connections

Configuring the Connection Pool


When the WebLogic Server starts up or when you deploy a data source to a new target, the connection pool is registered with the server, meaning that the connection pool and its connections are created at that time. You can configure various settings to control the connection pool size and the way the pool can shrink and grow.  You should tune pool sizes based on DataSource statistics. For example, you should ensure connection wait time is not high.

We have listed some settings here that you may want to tune for your applications:
  • Initial Capacity
    • Number of connections created when pool is initialized
  • Minimum Capacity
    • Minimum number of connections that will be maintained in the pool
    • Should be tuned for steady load
  • Maximum Capacity
    • Maximum number of connections that pool can have
    • Should be tuned to peak load
  • Shrink Frequency 
    • Should be enabled to drop some connections from the data source when a peak usage period has ended, freeing up WebLogic Server and DBMS resources
It is common to set the initial capacity to a value that handles your estimated average, but not necessarily the maximum number of connections to the database. Ideally, you want to make sure that you have enough initial connections to match the number of concurrent requests that you expect to have running on any given server instance.

To be on the safe side, you can set the initial capacity to the same value as the maximum capacity—this way, the connection pool will have all the physical connections ready when the pool is initialized.  However, sometimes you do want to dynamically adjust pool size at run-time, see [5].

The rule of the thumb for pool sizing is simply to make sure that the pool is large enough for all server threads to get access to the pooled resources they need concurrently.  In previous versions of WebLogic Server,this was usually simple.  For example,each execute thread needs access to one database connection from each pool, so you always make sure that the maximum capacity of the database connection pool was greater than or equal to the number of execute threads. With the introduction of server self-tuning, the number of execute threads isn't necessarily well de๏ฌned.  Then, the tips provided here may be helpful to you.

Acknowledgement


Some writings here are based on the feedback from Sandeep Mahajan and Stevan Malesevic. However, the author would assume the full responsibility for the content himself.

References

  1. Professional Oracle WebLogic Server
  2. Oracle WebLogic Server 11gR1 PS2: Administration Essentials
  3. The WebLogic Server Administration Console
  4. Managing WebLogic JDBC Resources
  5. Dynamically Sizing JDBC Connection Pool in WebLogic Server
  6. Configuring JDBC Data Sources in JDeveloper and Oracle WebLogic Server
  7. Tuning WebLogic's Prepared Statement Cache
  8. Data Source Connection Pool Sizing

Monday, October 1, 2012

Performance Turning for WebLogic Server—Native Muxers vs. Java Muxers

There are two critical areas for WebLogic Server (WLS) performance tuning:
  • Thread management
  • Network I/O tuning
In this article, we will touch upon one aspect of Network I/O tuning—Native Muxers vs. Java Muxers.

Listen Thread


  Listen Thread ---> Listen Thread Queue --> Socket Muxer 

When a server process starts up, it binds itself to a port and assigns a listen thread to the port to listen for incoming requests.  Once the request makes a connection, the server passes the control of that connection to the socket muxer.

From the thread dump, you can find an entry like this:
  "DynamicListenThread[Default[9]]" daemon prio=10 tid=0x00002aaac921b800 
   nid=0x3bf1 runnable [0x000000004c026000]

From the server log file, you can find a matching entry like this:
  <Oct 2, 2012 11:02:28 AM PDT> <Notice> <Server> <BEA-002613>
  <Channel "Default[9]" is now listening on 0:0:0:0:0:0:0:1:9000 
  for protocols iiop, t3, ldap, snmp, http.>

Socket Muxer


  socket muxer --> execute queue 
Muxers read messages from the network, bundle them into a package of work, and queue them to the Work Manager.  An idle execute thread will pick up a request from the execute queue and may in turn hand off the job of responding to those requests to special threads.  Finally, socket muxers also make sure the response gets back to the same socket from which the request came. Socket muxers are software modules and there are two types:
  • Java Muxers
    • Uses pure Java to read data from sockets
    • The number of threads is tunable for Java muxers by configuring the Percent Socket Readers parameter setting in the Administration Console
  • Native Muxers 
    • Native muxers use platform-specific native binaries to read data from sockets
      • The majority of all platforms provide some mechanism to poll a socket for data
    • Native muxers provide better performance, especially when scaling to large user bases, because they implement a non-blocking thread model
    • Note that Native IO is not supported for WebLogic clients which includes WLST
The Enable Native IO checkbox on the server’s configuration settings tells the server which version to use.  In the above figure, we have selected Native IO and, therefore, JavaSocketMuxer Socket Readers was grayed out.

In general, the server will determine the correct type of muxer to use and will use the native muxers by default without having to make any specific tuning changes.

Which Muxer Was Actually Used?


The quickest way is to create a thread dump (for example, using jstack) and search for "Muxer".  In our experimental environment, Posix Muxer was picked up accidentally:

"ExecuteThread: '2' for queue: 'weblogic.socket.Muxer'" daemon prio=10 tid=0x00002aaae190b800 nid=0x10cf runnable [0x0000000040e13000]
   java.lang.Thread.State: RUNNABLE
        at weblogic.socket.PosixSocketMuxer.poll(Native Method)
        at weblogic.socket.PosixSocketMuxer.processSockets(PosixSocketMuxer.java

-Dweblogic.SocketReaders


You can explicitly set the number of socket readers using the following command line option:
  • -Dweblogic.SocketReaders=3
If you set it to be 3, you can find the following entries from the thread dump:
"ExecuteThread: '2' for queue: 'weblogic.socket.Muxer'" daemon prio=10 tid=0x00002aaac8776000 nid=0x3475 waiting for monitor entry [0x0000000041dbd000]
   java.lang.Thread.State: BLOCKED (on object monitor)

"ExecuteThread: '1' for queue: 'weblogic.socket.Muxer'" daemon prio=10 tid=0x00002aaac8774800 nid=0x3474 waiting for monitor entry [0x0000000041cbc000]
   java.lang.Thread.State: BLOCKED (on object monitor)

"ExecuteThread: '0' for queue: 'weblogic.socket.Muxer'" daemon prio=10 tid=0x00002aaac8770000 nid=0x3473 runnable [0x0000000041877000]
   java.lang.Thread.State: RUNNABLE

The main reason to do this is that in some releases the number of readers is set by default to the number of CPUs available on the system. On some types of hardware this results in as many as 128 reader threads, which is not so good.

Typically you will see good performance anywhere between 1-3 socket readers threads. In some case, folks have used 6—but, those are special cases.  Be warned that not having enough readers will result in work not being read from the sockets quickly enough for the server to process.

Using our ATG CRM benchmark, you can see the changes of throughput and response time when number of SocketReaders is changed from 1 to 3:


SocketReaders=1

SocketReaders=3

Maximum Running Vusers 400 400
Total Throughput (bytes) 2,487,087,264 2,496,307,995
Average Throughput (bytes/second) 1,036,286 1,040,128
Average Hits per Second 29.786 29.86
Average Response Time (seconds) 0.248 0.236
90% Response Time (seconds) 0.209 0.210


BEA-000438


In some circumstances, you may see the following error message:
  <BEA-000438> <Unable to load performance pack. Using Java I/O instead.
  Please ensure that libmuxer library is in...
For instance, when you use 64-bit JVM and libmuxer.so is not on the LD_LIBRARY_PATH.  To resolve it, just add the following path:
  • <Oracle Home>/wlserver_10.3/server/native/linux/x86_64
to the LD_LIBRARY_PATH.

Acknowledgement


Some of the writings here are based on the feedback from Sandeep Mahajan. However, the author would assume the full responsibility for the content himself.

References

  1. Oracle WebLogic Server 11g Administration Handbook (Oracle Press)
  2. HotSpot VM Binaries: 32-Bit vs. 64-Bit
  3. Weblogic - Socket Muxers in Thread Dumps

Saturday, September 29, 2012

Monitoring WebLogic Server Thread Pool at Runtime

There are two critical areas for WebLogic Server performance tuning:
  • Thread management
  • Network I/O tuning
Before any tuning, you need to identify areas of bottlenecks first.  In this article, we will focus on thread management and specifically its run-time health monitoring.

Thread Pool


There are thread pool implementation changes since WLS 9.0: 
  • Previous versions
    • Multiple pools of threads 
    • See [7] on how to use the WebLogic 8.1 thread pool model for backward compatibility
  • WLS 9.0 and above
    • A single dynamically sized pool of threads (or self-tuning thread pool)
    • Self-tuning work manager[8,9]
New WebLogic Server uses a single thread pool, in which all types of work are executed. Here we summarize how the new implementation works:
  • WebLogic Server prioritizes work and allocates threads based on an execution model that takes into account 
    • Administrator-defined parameters 
    • Actual run-time performance 
      • Throughput
  • The common thread pool changes its size automatically to maximize throughput.
    • This new strategy makes it easier for administrators to allocate processing resources and manage performance, avoiding the effort and complexity involved in configuring, monitoring, and tuning custom executes queues. 
    • The queue monitors throughput over time and based on history, determines whether to adjust the thread count.  For example,
      • Thread count will be increased when:
        • If historical throughput statistics indicate that a higher thread count increased throughput, WebLogic increases the thread count. 
      • Thread count will be reduced when
        • If statistics indicate that fewer threads did not reduce throughput, WebLogic decreases the thread count. 
In general, the self-tuning thread pool changes its size automatically to maximize throughput, so in normal cases there is nothing you need to do aside from monitoring it to understand the behavior of your server under different types of load.

WebLogic Server Monitoring Dashboard


From the Oracle WebLogic Administration Console, you can navigate to

  • Servers | SalesServer_1 | Monitoring | Threads 

to view important statistics related to thread pool and thread pool threads.

Everything from Active Execute Threads to Min Threads Contrain Complete is shown on this page.


From the dashboard, the thread pool runtime can be monitored in real-time. The key KPI's to monitor include[2]:
  • Hogging Thread Count 
    • The threads that are being held by a request right now. These threads will either be declared as stuck after the configured timeout or will return to the pool before that. The self-tuning mechanism will backfill if necessary.
  • Pending User Request Count
    • The number of pending user requests in the priority queue. The priority queue contains requests from internal subsystems and users. This is just the count of all user requests.
  • Queue Length
    • The number of requests queued up when you don’t have idle threads.  
On a low usage environment, these should ideally be hovering around zero.

Another KPI worth of monitoring is
  • Throughput
    • The Throughput is a single value that denotes the mean number of requests completed per second. 
The higher this value is, the better it is.

Pool Size


In some cases, you do want to set the range of pool size.  For example, for our Fusion Application benchmarks, our area of interest is in the JVM (i.e, not upper layers).  In that case, we want to reduce the variation introduced by the self-tuning of thread pool and set our thread pool size to be:
  • -Dweblogic.threadpool.MinPoolSize=32 -Dweblogic.threadpool.MaxPoolSize=32
The general rule[4] for pool sizing or other kinds of tuning is to start with no specific tuning and then configure Work Managers only to address specific problems that might arise. Aggressively configuring Work Managers for a specific environment can end up hurting performance when your application, workload, or underlying system changes.

Stuck Threads


If an execute thread is being hogged by a request for much more than the normal execution time (as automatically observed by the scheduler), it's declared as a hogger.  These threads will either be declared as stuck after the configured timeout (by default, 10 min of processing time) or will return to the pool before that.

If you find any thread's state become STUCK, it's the time you start investigating—does the stuck thread ever recover or does it stay stuck indefinitely?  By default, Oracle Fusion Apps is configured to generate an incident when a STUCK thread is detected.  You can find them here:
  • <DOMAIN_HOME>/servers/<server_name>/adr/diag/ofm/<domain_name>/<server_name>/incident
The incident contains some key diagnostic information that can be used to help understand why the request took so long.

What to Expect if Things Work Normally?


This thread below is what an execute thread in the WebLogic Server self-tuning pool looks like when there is nothing for it to do.
"[ACTIVE] ExecuteThread: '0' for queue: 'weblogic.kernel.Default (self-tuning)'" id=15 idx=0x3c tid=3810 prio=5 alive, waiting, native_blocked, daemon
    -- Waiting for notification on: weblogic/work/ExecuteThread@0xa0c21480[fat lock]
    at jrockit/vm/Threads.waitForNotifySignal(JLjava/lang/Object;)Z(Native Method)
    at java/lang/Object.wait(J)V(Native Method)
    at java/lang/Object.wait(Object.java:485)
    at weblogic/work/ExecuteThread.waitForRequest(ExecuteThread.java:162)
    ^-- Lock released while waiting: weblogic/work/ExecuteThread@0xa0c21480[fat lock]
    at weblogic/work/ExecuteThread.run(ExecuteThread.java:183)
    at jrockit/vm/RNI.c2java(JJJJJ)V(Native Method)
    -- end of trace

The thread below is a timer thread waiting to be notified that it is time to wake up and do whatever it is supposed to do:
"JFR request timer" id=16 idx=0x40 tid=3811 prio=5 alive, waiting, native_blocked, daemon
    -- Waiting for notification on: java/util/TaskQueue@0xa0c20b28[fat lock]
    at jrockit/vm/Threads.waitForNotifySignal(JLjava/lang/Object;)Z(Native Method)
    at java/lang/Object.wait(J)V(Native Method)
    at java/lang/Object.wait(Object.java:485)
    at java/util/TimerThread.mainLoop(Timer.java:483)
    ^-- Lock released while waiting: java/util/TaskQueue@0xa0c20b28[fat lock]
    at java/util/TimerThread.run(Timer.java:462)
    at jrockit/vm/RNI.c2java(JJJJJ)V(Native Method)
    -- end of trace

What state is the “main” thread in? It should look something like this one:
"main" prio=6 tid=0x000000000224f000 nid=0x2e64 runnable [0x00000000023de000]
   java.lang.Thread.State: RUNNABLE
        at weblogic.i18n.Localizer.prune(Localizer.java:358)
        at weblogic.i18n.Localizer.getObject(Localizer.java:164)
        at weblogic.i18n.Localizer.getDiagnosticVolume(Localizer.java:344)
        at weblogic.i18n.logging.CatalogMessage.(CatalogMessage.java:53)
        at weblogic.kernel.T3SrvrLogger.logServerStateChange(T3SrvrLogger.java:2084)
        at weblogic.t3.srvr.T3Srvr.setState(T3Srvr.java:211)
        - locked <0x00000000e0a30d78> (a weblogic.t3.srvr.T3Srvr)
        at weblogic.t3.srvr.T3Srvr.initializeAdmin(T3Srvr.java:921)
        at weblogic.t3.srvr.T3Srvr.startup(T3Srvr.java:589)
        at weblogic.t3.srvr.T3Srvr.run(T3Srvr.java:471)
        at weblogic.Server.main(Server.java:74)

References

  1. Oracle® Fusion Applications Performance and Tuning Guide 11g Release 1 (11.1.4)
  2. Oracle SOA Suite 11g Administrator's Handbook
  3. Tuning WebLogic Server
  4. Oracle WebLogic Server 11g Administration Handbook
  5. Controlling Thread Pool Size in WebLogic Server
  6. Understanding JVM Thread States
  7. Using the WebLogic 8.1 Thread Pool Model
    • Describes how to use and tune WebLogic 8.1 thread pools
  8. Using Work Managers to Optimize Scheduled Work
  9. Understanding WebLogic Work Manager
  10. Oracle® Fusion Middleware Tuning Performance of Oracle WebLogic Server 12c (12.2.1)
  11. Data Source Connection Pool Sizing (The Weblogic Server Blog)

Friday, April 13, 2012

How to Force Shutdown WebLogic Managed Server

WebLogic Server (WLS) provides several ways to start and stop server instances[1]. The method that you choose depends on whether you prefer using the Administration Console or a command-line interface, and on whether you are using Node Manager to manage the server's life cycle.

In this article, we will show you how to force shutdown WLS Managed Server from the command-line. This may come in handy when your WLS Managed Servers have stuck threads and will take you minutes to connect to it using the Console. Also, you don't care about dropping any user sessions. For example, in our case, we are just running some performance benchmarks.

stopManagedWebLogic.sh

You can stop WLS Managed Server using stopManagedWebLogic.sh script provided in your domain:
  • <domain_path>/bin
Note that the environment we demonstrate here is in Linux.  The syntax of the command is:
  • DOMAIN_NAME/bin/stopManagedWebLogic.sh managed_server_name admin_url username password
For example, we use:
  • ./stopManagedWebLogic.sh CRMDemo_server1 t3://<machine_name>:7001 weblogic weblogic1
However, the default setting is not FORCE SHUTDOWN as shown in the following output line:

Shutting down the server CRMDemo_server1 with force=false while connected to AdminServer ...

stopWebLogic.sh

stopManagedWebLogic.sh actually invokes stopWebLogic.sh indirectly as shown here:

 ${DOMAIN_HOME}/bin/stopWebLogic.sh $1 $2

To make it shutdown forcibly, you need to modify the following line in the stopWebLogic.sh from:
  • echo "shutdown('${SERVER_NAME}','Server', ignoreSessions='true')" >>"shutdown.py"
to
  • echo "shutdown('${SERVER_NAME}','Server', ignoreSessions='true', force='true')" >>"shutdown.py"
Note that WLST shutdown command[2] is used to do the work in the script.

Sample Output

After changing the script file, we re-execute the command and here is the sample output:
Stopping Weblogic Server...

Initializing WebLogic Scripting Tool (WLST) ...

Welcome to WebLogic Server Administration Scripting Shell

Type help() for help on available commands

Connecting to t3://<machine_name>:7001 with userid weblogic ...
Successfully connected to Admin Server 'AdminServer' that belongs to domain 'xxxx'.

Warning: An insecure protocol was used to connect to the
server. To ensure on-the-wire security, the SSL port or
Admin port should be used instead.

Shutting down the server CRMDemo_server1 with force=true while connected to AdminServer ...
......................................................
Exiting WebLogic Scripting Tool.

Done
Stopping Derby Server...

Stopping Admin Server

Because our change was done in stopWebLogic.sh, if you want to shutdown Admin Server, it also becomes FORCE SHUTDOWN as shown below:

$ ./stopWebLogic.sh
Stopping Weblogic Server...
Initializing WebLogic Scripting Tool (WLST) ...

Welcome to WebLogic Server Administration Scripting Shell

Type help() for help on available commands

Please enter your username :weblogic
Please enter your password :
Connecting to t3://<server_name>:7001 with userid weblogic ...
Successfully connected to Admin Server 'AdminServer' that belongs to domain 'atgdomain'.

Warning: An insecure protocol was used to connect to the
server. To ensure on-the-wire security, the SSL port or
Admin port should be used instead.

Shutting down the server AdminServer with force=true while connected to AdminServer ...
WLST lost connection to the WebLogic Server that you were
connected to, this may happen if the server was shutdown or
partitioned. You will have to re-connect to the server once the
server is available.
Disconnected from weblogic server: AdminServer
Disconnected from weblogic server:


Exiting WebLogic Scripting Tool.

Done
Stopping Derby Server...

Conclusion

Be warned that:
  • If you force shutdown server instances, the server immediately stops all processing. Therefore, any pending session data may be lost. 
  • Each WebLogic Server instance runs in its own JVM. If you are unable to shut down a server instance using the methods described, you can use an operating system command to kill the JVM.  However, if you kill the JVM for an Administration Server while the server is writing to the config.xml file, you can corrupt the config.xml file.

References

  1. Oracle® Fusion Middleware Managing Server Startup and Shutdown for Oracle WebLogic Server 11g Release 1 (10.3.4)
  2. WLST Command and Variable Reference
  3. Starting and Stopping Fusion Applications the Right Way (Oracle A-Team)
  4. Oracle WebLogic Server on Docker Containers (white paper)
  5. WebLogic on Docker (GitHub)
    • Sample Docker configurations to facilitate installation, configuration, and environment setup for DevOps users. This project includes quick start dockerfiles and samples for both WebLogic 12.1.3 and 12.2.1 based on Oracle Linux and Oracle JDK 8 (Server).

Tuesday, April 3, 2012

Configuring WebLogic Server with a Different JVM

If you need to configure WebLogic Server to use a differnt JVM, you need to deal with two environment variables:
  • JAVA_HOME
    •  Specifies the location of the version of Java used to start WebLogic Server
  • JAVA_VENDOR
    • Specifies the vendor of the JVM (i.e., "Sun", "Oracle", etc.)
In this article, we will examine how these two variables interplay and how do you make changes.  In general, JAVA_VENDOR, if found, is used to define JAVA_HOME.  But, setting JAVA_VENDOR to select which JDK to use depends on whether the system have found the JDK you want to use at the time that WebLogic Server was installed.

BEA_JAVA_HOME and SUN_JAVA_HOME

When WebLogic Server installs, if it can find a JRockit JDK and a Sun JDK, it sets the variables BEA_JAVA_HOME and SUN_JAVA_HOME as shown below:

BEA_JAVA_HOME=""
export BEA_JAVA_HOME
SUN_JAVA_HOME="<path_to_jdk>/jdk6"
export SUN_JAVA_HOME

in the setDomainEnv.sh (or .cmd) file.  In our environment, it has only Sun JDK and no JRockit JDK.  So, that's why you see that BEA_JAVA_HOME was set to be "".

The actual JDK that is used is then determined if the JAVA_VENDOR="Sun" (then use SUN_JAVA_HOME) or JAVA_VENDOR="Oracle" (use BEA_JAVA_HOME).

 if [ "${JAVA_VENDOR}" = "Oracle" ] ; then
        JAVA_HOME="${BEA_JAVA_HOME}"
        export JAVA_HOME
else
        if [ "${JAVA_VENDOR}" = "Sun" ] ; then
                JAVA_HOME="${SUN_JAVA_HOME}"
                export JAVA_HOME
        else
                JAVA_VENDOR="Sun"
                export JAVA_VENDOR
                JAVA_HOME="<path_to_jdk>/jdk6"
                export JAVA_HOME
        fi
fi

But if the JDKs weren't found on install, setting JAVA_VENDOR doesn't work, and if you want a completely arbitrary JDK, then you have to change the appropriate JAVA_HOME variable.

In the above setDomainEnv.sh, it first tries to use JAVA_VENDOR to determine which JDK to use.  If the user didn't set that before WLS is started, it will use the default (i.e., the only JDK found during installation). If you want to use a JDK not found at installation time, you may need to manually change setDomainEnv.sh to fit your needs.

Monday, March 26, 2012

Controlling Thread Pool Size in WebLogic Server

One of the critical areas that relate to the tuning of WebLogic Server is thread management[1].  In previous versions of WebLogic Server, processing was performed in multiple execute queues. Different classes of work were executed in different queues, based on priority and ordering requirements, and to avoid deadlocks.  However, in WLS 9.0 and above, it uses a single thread pool, in which all types of work are executed.[10] WebLogic Server prioritizes work based on rules you define, and run-time metrics, including the actual time it takes to execute a request and the rate at which requests are entering and leaving the pool.

Self-tuning Thread Pool[7]


WebLogic uses work managers with a variable and self-tuning number of worker threads. By default, the self-tuning thread pool size limit is 400. This limit includes all running and idle threads, but does not include any standby threads. The size of thread pool grows and shrinks automatically to improve throughput.  Measurements are taken every 2 seconds and the decision to increase or decrease the thread count is based on the current throughput measurement versus past values.

Thread Management[4]


If your server has four physical processors, theoretically you only need a thread pool with four threads. When you have more threads than there are CPU resources, the throughput may suffer. However, if your threads often make database connections or call some other long-running tasks where they need to wait, you do want to have more threads around so that the ones that aren't waiting can do some work.

In a 3-tiered architecture, you can also have a situation like this: the clients make requests coming into the application server faster than the database server can handle.  Then the clients keep adding requests on the application server until all its threads are busy, all of which just adds load to the database.  The more load you add to the application server that is overloaded, the worse you make the situation.  In other cases that clients cannot keep all threads on the application server busy and leave some of them idle, you may still lose throughput because the cache will be less efficient when a new thread takes a new request versus when a just-used thread takes a new request.

At any rate, tuning the size of thread pool is challenging and time consuming.  Internally Weblogic Server has many work managers configured for different types of work. If WLS runs out of threads in the self-tuning pool (because of system property -Dweblogic.threadpool.MaxPoolSize) due to being undersized, then important work that WLS might need to do could be starved.  While limiting the self-tuning would limit the default WorkManager and internally it also limits all other internal WorkManagers which WLS uses.  So, leaving that task to WebLogic Server seems to be a wise choice. 

However, there are some cases that we do need to set the size of thread pool manually.  For example, to make performance comparison between two different test cases, you may want to eliminate the thread-pool-size variance from the performance results.  In this article, we will show you how to set up minimum and maximum thread pool sizes and how to examine the results of the settings.

Controlling the Size of Thread Pool


There are different ways of changing the size of thread pool.  One way of doing it is by setting them from the command line:
  • -Dweblogic.threadpool.MinPoolSize=5 -Dweblogic.threadpool.MaxPoolSize=5
By setting both MinPoolSize and MaxPoolSize to be the same value, we have forced WLS to use exactly five worker threads.  In our case, our two test cases will be compared with the same number of worker threads and prevent the self-tuning effects from contaminating our performance results.  In [8], it also tells us how to make similar changes via config.xml.

Threads Page on WLS Console


For a WebLogic Server administrator, the WLS console is indispensable for monitoring running server instances, including the various subsystems such as security, JTA, and JDBC. The Threads page on the WLS console provides information on the thread activity for the current server.  In Figure 1, it shows that there are five Active Execute Threads based on our configuration.  If we didn't configure the thread pool size, you could see number of Active Execute Threads changing dynamically due to WLS' self-tuning activities.


.

Default Execute Queue from Thread Dump


Besides monitoring number of worker threads from the WLS console, you can also examine them from the thread dump as generated from JStack[3].

Unless you've customized the execute queue (or thread pool) that your application gets deployed to, you can look for "Default" execute queue.  In the dump file, you'll look for the threads marked as 'weblogic.kernel.Default' to see what's running.  As work enters an instance of WLS, it is placed in the default execute queue.  This work is then assigned to a worker thread that does the work on it.

$ grep weblogic.kernel.Default threadDump.fod1
"[STANDBY] ExecuteThread: '6' for queue: 'weblogic.kernel.Default (self-tuning)'" daemon prio=10 tid=0x00000000202d9800 nid=0x404a in Object.wait() [0x0000000040801000]
"[STANDBY] ExecuteThread: '5' for queue: 'weblogic.kernel.Default (self-tuning)'" daemon prio=10 tid=0x0000000021813800 nid=0x3d13 in Object.wait() [0x000000004c52d000]
"[ACTIVE] ExecuteThread: '4' for queue: 'weblogic.kernel.Default (self-tuning)'" daemon prio=10 tid=0x00002aaabc0c6800 nid=0x3811 runnable [0x000000004a107000]
"[ACTIVE] ExecuteThread: '3' for queue: 'weblogic.kernel.Default (self-tuning)'" daemon prio=10 tid=0x00002aaabc0c5000 nid=0x3810 in Object.wait() [0x000000004a008000]
"[ACTIVE] ExecuteThread: '2' for queue: 'weblogic.kernel.Default (self-tuning)'" daemon prio=10 tid=0x00002aaabc0c1800 nid=0x380f in Object.wait() [0x0000000049f06000]
"[ACTIVE] ExecuteThread: '1' for queue: 'weblogic.kernel.Default (self-tuning)'" daemon prio=10 tid=0x00002aaabc0db800 nid=0x380e in Object.wait() [0x000000004194e000]
"[ACTIVE] ExecuteThread: '0' for queue: 'weblogic.kernel.Default (self-tuning)'" daemon prio=10 tid=0x00002aaabc0bc800 nid=0x380d in Object.wait() [0x000000004184d000]

As shown above, you can find there are seven instances of 'weblogic.kernel.Default (self-tuning)'.  Five of them are active and two of them are in standby.[11]  These five active instances match what we've found as "Active Execute Thread" on the WLS console.

References

  1. Oracle WebLogic Server 11g Administration Handbook by Sam Alapati
  2. Using Work Managers to Optimize Scheduled Work
  3. Fun with JStack by Scott Oaks
  4. Rewritten from personal's email exchanges with Scott Oaks
  5. Monitoring WebLogic Server Thread Pool at Runtime
  6. Understanding JVM Thread States
  7. Self-Tuning Thread Pool
  8. Tuning Default WorkManager - Advantages and Disadvantages
  9. Fusion Middleware Performance and Tuning for Oracle WebLogic Server
  10. Understanding the Differences Between Work Managers and Execute Queues
  11. STANDBY thread (WLS)
    • ACTIVE threads can go to STANDBY when it is deemed that you don’t need that many active threads.
    • But, a STANDBY thread can still be used (without transitioning to ACTIVE) in order to satisfy a min threads constraint.
  12. Top Tuning Recommendations for WebLogic Server (12.2.1.3.0)
  13. Analyzing Thread Dumps in Middleware - Part 2

Tuesday, March 20, 2012

Using JXplorer to Learn Oracle Internet Directory

JXplorer[1] is an open source ldap browser originally developed by Computer Associates' eTrust Directory development lab. It is a standards compliant general purpose ldap browser that can be used to read and search any ldap directory, or any X500 directory[4] with an ldap interface.

Oracle Internet Directory (OID) is an LDAP V3-compliant directory service.  LDAP (Lightweight Directory Access Protocol) was conceived as an Internet-ready, lightweight implementation of the X.500 standard for directory services.  In this article, we will use JXplorer to explore the structure of OID.

OID Component and Instance

When you install Oracle Internet Directory[2] on a host computer, Oracle Identity Management 11g Installer creates a system component of type OID in a new or existing Oracle instance.

The Oracle Internet Directory component contains an OIDMON process (i.e. Oracle Internet Directory Monitor process) and an Oracle Internet Directory instance. The Oracle Internet Directory instance consists of a dispatcher process and one or more OIDLDAPD processes.


The component name for the first Oracle Internet Directory component is usually oid1 and the Oracle instance name is chosen during the installation, usually asinst_1.

Oracle Identity Management 11g Installer also creates the following instance-specific configuration entry for this component during installation:
  • cn=oid1,cn=osdldapd,cn=subconfigsubentry

In summary, OID components and instances are created as below:
  • oid1
    • The first Oracle Internet Directory component
        • Successive installations in the cluster will have the component names oid2, oid3, and so forth.
        • This new Oracle Internet Directory component consists of 
          • An OIDMON process
          • An OIDLDAPD dispatcher process
          • One or more OIDLDAPD server processes
      • File system directories created by installer
        • ORACLE_INSTANCE/config/OID/oid1
        • ORACLE_INSTANCE/diagnostics/logs/OID/oid1
    • asinst_1
      • Oracle instance name is chosen during the installation, usually is asinst_1

    JXplorer

    You explore OID by making a connection to it first.  An LDAP server is called a Directory System Agent (DSA).
    OID uses the following default ports:
    • SSL port: 3131
    • Non SSL port: 3060
     In the User DN, you specify:
    • cn=orcldadmin
    On the left panel, you can find oid1 in the hierarchical tree-like structure (i.e., Directory Information Tree).  If you right click on it and select Copy DN,

    the DN (i.e., distinguished name) of oid1 configuration entry is returned:
    • cn=oid1,cn=osdldapd,cn=subconfigsubentry

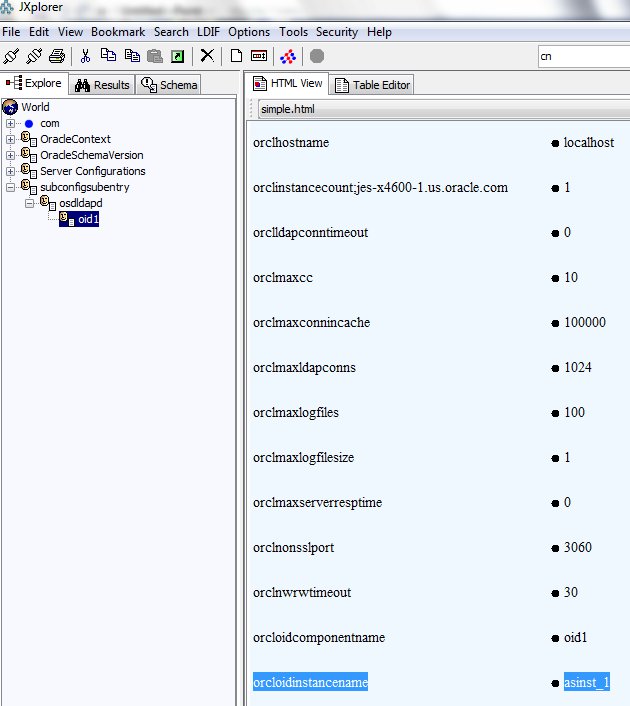
    The action in LDAP takes place around entries such as oid1.  An entry is defined as a set of attributes, and an attribute is a set (i.e., unordered) of values.  For example, oid1 has the following attributes:
    • orcloidinstancename: asinst_1
    • orclmaxcc: 10
    • etc.
    OID component oid1 has one instance named asinst_1.   It also has other attributes such as orclmaxcc which specifies maximum number of DB connections or orclserverprocs which specifies number of server processes.  You can modify them to tune OID's performance.

    Configuring the Oraccle Internet Directory Authentication Provider

    You can follow the instructions here to set up OID as one of the authentication providers in WebLogic Server.  Some of the information required for the setup can also be found from JXplorer.  For example, to find user base DN and group base DN, you can right click on the Users or Groups and select "Copy DN":
     
    • User base DN : cn=Users, dc=us, dc=oracle, dc=com 
    • Group base DN : cn=Groups, dc=us, dc=oracle, dc=com
    Entry's name is specified by LDAP's naming model.  Entry's name (i.e., a DN) is composed of RDNs (i.e., Relative Distinguished Name) which are separated by commas.   DNs are more like postal addresses because they have a “most specific component first” ordering.  In our example, entry Users has a distinguished name:
    • cn=Users, dc=us, dc=oracle, dc=com
    where cn is the shorthand for common name and dc is the shorthand for domain componentUser base DN and group base DN are used by WebLogic Server to search users and groups within OID.

    References

    1. JXplorer
    2.  Oracle® Fusion Middleware Administrator's Guide for Oracle Internet Directory 11g Release 1 (11.1.1)
    3. Lightweight Directory Access Protocol
    4. International Standardization Organization (ISO) X.500 
    5. Configure the Oracle Internet Directory Authentication provider
    6. Oracle Fusion Middleware Security Blog

    © Travel for Life Guide. All Rights Reserved.

    Analytical Insights on Health, Culture, and Security.