Cross Column

Showing posts with label JDeveloper 11g. Show all posts

Tuesday, April 3, 2012

Configuring JDeveloper with a Different JDK

In JDeveloper, you can change the JDK version (for example, changing from 32-bit to 64-bit) that the IDE uses or the project uses easily.  But, don't be confused with which is which.  In this article, we will introduce you how to do both.

Java SE Definitons

JDeveloper uses Java SE definitions to describe an installed Java SE environment. This environment can be either a JRE or an SDK.

Note that if you are using a JRE, some features may not be available. Every JDeveloper project uses a Java SE definition to determine what version of the Java API to compile and run with.

Changing JDK That IDE Uses

To change JDK that IDE uses, you can do this:
  • Configuring JDeveloper via the SetJavaHome configuration parameter in the jdev.conf.
Noted that directive SetJavaHome is not required by default, except for the base install, since the launcher will determine the JAVA_HOME.  On Windows it looks in ..\..\jdk, on UNIX it first looks in ../../jdk. If no JDK is found there, it looks in the PATH.

JDeveloper creates a Java SE definition for the Java SE environment being used to run JDeveloper. By default, this definition is used by all new projects. However, additional definitions can be created from any available Java SE. These new definitions can be created in either the user libraries or the system libraries. In a multiuser environment, Java SE definitions created in the user libraries are user specific, while ones created in the system libraries are shared by all users.

To create a new Java SE definition, you follow these steps:

Tools > Manage Libraries > Java SE Definition > New
This will bring up a Create Java SE dialog:
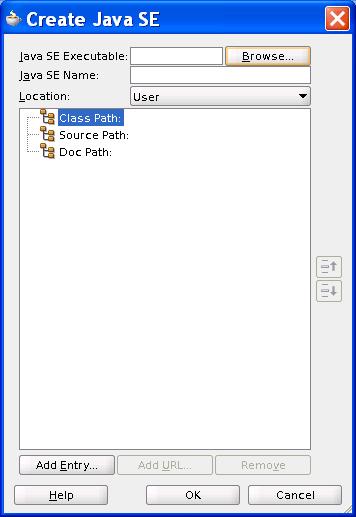
Each Java SE definition encapsulates:
  • a Java executable—used for launching programs
  • a classpath—containing the classes available within the Java SE environment
  • a source path—containing the source files associated with the Java SE classes
  • a doc path—containing the Javadoc files for the Java SE classes
From now on, JDeveloper will use the new JDK for its operation.   For existing projects, we need to make sure it uses the new JDK.

Changing JDK That Project Uses

Setting the target Java SE specifies which Java SE JDeveloper will use when compiling and running your project.

To view or change the current Java SE for an individual project:
  1. In the Application Navigator, select the appropriate project.
  2. From the main menu, choose Application > Project Properties, or right-click and choose Project Properties.  The Project Properties dialog opens with the common input paths displayed or on the last page that you viewed.
  3. On the Libraries and Classpath page the Java SE Version used for the project is displayed. Click Change to define a new Java SE.
  4. When finished, click OK.


Also Consider...

When you run the Integrated WebLogic[3] for the first time in the JDeveloper, the
  • .jdeveloper/system11.1.1.x.xx.xx.xx/DefaultDomain/bin/startWebLogic.sh
script will be created.  Associated with that, the setDomainEnv.sh script will be created in the same directory.  So, if you do want to change the JDK location, you may want to change this file as well.

Finally, JDeveloper enables you to manage libraries and Java SEs outside the project scope too.  To learn more, read [4].

References

  1.  JDeveloperWorking with Applications and Projects
  2. Oracle JDeveloper 11gR2 Cookbook by Nick Haralabidis
  3. Integrated WebLogic Server (WLS)
  4. Managing Libraries and Java SEs Outside the Project Scope 
  5. What operating systems and JDK's are supported for the JDeveloper IDE?

Wednesday, January 4, 2012

Starting the CPU Profiler in JDeveloper

JDeveloper offers two kinds of profilers: The CPU Profiler and the Memory Profiler, for local as well as remote profiling.
  • CPU Profiling enables you to identify the most expensive methods and threads in your program.
  • Memory profiling helps you to find out how your program is using the Java heap.
In this article, we will show you how to:
  • Set Options for the CPU Profiler
  • Start the CPU Profiler
CPU Profiler

The CPU Profiler tabulates and displays statistical data on the performance of your application. It enables you to profile your code in one of two modes:
  • Sample CPU Time
  • Method Call Count
In Figure 1, it shows the result of method call count operation.


Figure 1. Hotspots view of the method call count operation


Figure 2. Call Stacks view of the method call count operation

The CPU Profiler displays data in two views:
  • Hotspots
  • Call Stacks
Also, depending on the mode of operation, they display different information.

In the method call count operation, these views show:
  • Hotspots
    • all the methods and the number of times they were called (see Figure 1)
  • Call Stacks
    • the Java platform methods called, sorted by thread group (see Figure 2)
In the time sampling mode of operation, these views show:
  • Hotspots
    • all Java platform methods and all methods they call, sorted by time usage
    • the cumulative amount of CPU time spent in each method
  • Call Stacks
    • the Java platform methods called in their call hierarchy

Setting Options for the CPU Profiler

You can specify if you want the Profiler to sample CPU time usage by your application, or to count method calls. Note that you can choose one mode at a time, not both.

To set CPU Profiler options:
  • In the navigator, double-click the project you want to profile to open the Project Properties dialog.
  • Click Run/Debug/Profiler to open the Project Properties - Run/Debug/Profile page.
  • Click Edit.
  • In the Edit Run Configuration dialog, set the options as desired on the Tool Settings - Profiler - CPU page. You can specify if you want the profiler to sample CPU time or count method calls. In Figure 3, we want the profiler to count method calls.
  • When finished, click OK to close the Edit Run Configuration dialog.

Figure 3. Edit Run Configuration Dialog

Starting the CPU Profile
r

Starting a CPU profiling session will automatically run your program. Once the CPU profiler window is open (see Figure 1), you can begin a use case to profile your application.

To start the CPU Profiler:
  1. In the navigator, select the project you want to profile. For example, OsmPublicUi.
  2. From the main menu, choose Run > CPU Profile OsmPublicUi.jpr.
  3. The CPU Profiler opens and runs your application.
  4. Click the Begin Use Case icon to begin a profiling

Figure 4. Starting the CPU Profiler
More Hints

If no default run target is specified in the Launch Settings page of the Edit Run Configuration dialog (Application menu > Project Properties > Run/Debug/Profile), the Choose Default Run Target dialog opens. Use this dialog to specify the default run target.

If you want to profile your application immediately when the profiler is launched, select the Begin Use Case on Application Startup checkbox in Profiler page of Edit Run Configuration dialog (see Figure 5).

If you want to analyze a specific method or class you might be interested in, enter the name of a particular method or class in your application in Method Filter (see Figure 5) at the options setting step.


References
  1. Oracle® Fusion Middleware User's Guide for Oracle JDeveloper 11g Release 2 (11.1.2.0.0) Profiling a Project

Tuesday, July 26, 2011

Beautifying Table and Column Comments for Design Review

Data model design is an iterative process. As soon as the conceptual data model is accepted by the functional team, development of logical data model gets started. Once logical data model is completed, it is then forwarded to functional teams for review. A good data model is created by clearly thinking about the current and future business requirements.

To facilitate the review process, you need to present descriptions of entities and attributes in the data model to the functional team. Some database developers prefer working at source level (i.e., SQL DDL). For example, you can present the following EMP table to the team for review:
-- Employee Data
CREATE TABLE "SCOTT"."EMP"
(
"EMPNO" NUMBER(4,0),        -- employee number
"ENAME" VARCHAR2(10 BYTE),  -- employee name
"JOB"   VARCHAR2(9 BYTE),   -- job description
"MGR"   NUMBER(4,0),        -- manager ID
"HIREDATE" DATE,            -- hiring date
"SAL"    NUMBER(7,2),       -- salary
"COMM"   NUMBER(7,2),       -- commission
"DEPTNO" NUMBER(2,0),       -- department number
CONSTRAINT "PK_EMP" PRIMARY KEY ("EMPNO") USING INDEX PCTFREE 10 INITRANS 2 MAXTRANS 255 COMPUTE STATISTICS STORAGE(INITIAL 65536 NEXT 1048576 MINEXTENTS 1 MAXEXTENTS 2147483645 PCTINCREASE 0 FREELISTS 1 FREELIST GROUPS 1 BUFFER_POOL DEFAULT FLASH_CACHE DEFAULT CELL_FLASH_CACHE DEFAULT) TABLESPACE "USERS" ENABLE,
CONSTRAINT "FK_DEPTNO" FOREIGN KEY ("DEPTNO") REFERENCES "SCOTT"."DEPT" ("DEPTNO") ENABLE
)
In this article, we will show another way which presents the following table generated semi-automatically from the offline database using JDeveloper and Microsoft Excel:
Using the first approach, the drawbacks include:
  • SQL DDL scripts tend to be error-prone
  • Comments are only for human reader and not part of the DB definitions
That's why we propose the second approach which can resolve these two issues.


Offline Database

In JDeveloper, database development is available offline in the context of a project, allowing developers to create and manipulate schemas of database objects which can be generated to a database or to SQL scripts. Database objects can also be imported from a database into a project. See my previous post for more details.

You can follow the instructions in [1, 2] to create offline database objects. For the demo, I've created a database diagram and drag an existing EMP table from the SCOTT schema to create a table on it.


Adding Comments

Double-click the EMP table component on the diagram to open the Edit Table dialog,

Select Comment in the navigation panel to enter table's comment as shown above.
Select Columns in the navigation panel and navigate them one by one. In the Comment field, enter column's comment as shown above. Click Save All to save your work.

In the Application Navigator, under Offline Database Sources | EMP_DATABASE | SCOTT, right-click the EMP node, and choose Generate To > SQL script ... to create SQL script file named emp.sql.
Open emp.sql in the editor window. Look for comments of table's and columns' at the bottom of the script as shown below:

COMMENT ON TABLE EMP IS 'Employee Data';

COMMENT ON COLUMN EMP.EMPNO IS 'employee number';

COMMENT ON COLUMN EMP.ENAME IS 'employee name';

COMMENT ON COLUMN EMP.JOB IS 'job description';

COMMENT ON COLUMN EMP.MGR IS 'manager ID';

COMMENT ON COLUMN EMP.HIREDATE IS 'hiring date';

COMMENT ON COLUMN EMP.SAL IS 'salary';

COMMENT ON COLUMN EMP.COMM IS 'commission';

COMMENT ON COLUMN EMP.DEPTNO IS 'department number';

Select the above comments and copy them into a text file (i.e., emp.txt).


Generating Comment Table

Start up Microsoft Excel and import text file as follows:
On the Text Import Wizard, you specify delimiters using space and paired single quotes as shown below:

After clicking on Finish button, you can remove column A,B, and E. It will then present you with the final comment table as shown at the beginning of this article.


Conclusion

Comment tables generated in the second approach have the following advantages:
  • The source of comment table is offline database object which can be validated by JDeveloper and can be source controlled.
  • They are part of the DB definitions and can be queried as follows:
    • select comments
      from user_tab_comments
      where table_name = 'EMP'
      /
    • select column_name, comments
      from user_col_comments
      where table_name = 'EMP'
      order by column_name
      /


References

  1. Database Development with JDeveloper
  2. Modeling Data with Offline Database in JDeveloper

Modeling Data with Offline Database in JDeveloper

For Oracle Applications developers, the JDeveloper offline database modeler replaces the Oracle Designer repository, or CASE as it was referred to. Applications developers should not use SQL DDL scripts for deployment and source control of database objects, because they tend to error-prone and do not serve as a single source of truth. Instead, developers should use the JDeveloper offline database object files.

What is the Offline Database

JDeveloper provides the tools you need to create and edit database objects, such as tables and constraints, outside the context of a database, using the offline Database model. You can create new tables and views, and generate the information to a database, or you can import database objects from a database schema, make the changes you want, and generate the changes back to the same database schema, to a new database schema, or to a file that you can run against a database at a later date.

Offline Database Model

The JDeveloper Offline database supports the following object types:
  • Function
  • Materialized View
  • Materialized View Log
  • Package
  • Procedure
  • Sequence
  • Synonym
  • Table
  • Trigger
  • Type
  • View
Currently, JDeveloper offline DB objects do not support these objects:
  • Queue
  • Queue tables
  • Policy
  • Context
However, SXML persistence files for these object types can be imported using the applxdf extension.
JDeveloper provides tools to create and edit database objects such as tables, view etc. outside the context of a database. This tool called Offline Database Definition will be used to model physical database objects in Fusion applications. The migration tool will support migrating all user selected database objects defined in CASE to this offline database definition in JDeveloper along with SXML/XDF1 deployment files.

Metadata SXML Comparison Tool[3]

Offline table definitions can be version controlled and shared using a source control system. If you just create objects in the DB schema via the database navigator, you have nothing to source control. JDeveloper provides a comparison tool optimized for working with offline table definitions, which handles:
  • The table data, properties, columns and constraints.
  • The identity of objects, to track name changes.
  • Checking for consistency, for example, ensuring:
    • That a column which is used in a key is not dropped.
    • That a constraint which uses an absent column is not added.
    • That a primary key column cannot be options.
Using this comparison tool, you can compare object metadata of the same type from different databases. This comparison depends on SXML. SXML is an XML representation which more closely maps to the SQL creation DDL. Two SXML documents of the same type can be compared and a new SXML document is provided which describes their differences.
Using this comparison tool, you're able to:
  • Compare object definitions in different JDeveloper projects
    • Since the objects to be compared are in separate projects, you need to create a dependency between them to be able to perform this comparison.
  • Compare versioned copies of DB objects
    • Versioning components allows you to browse through the historical changes of a component and make comparison between these versions. With JDEV, it's possible to compare different versions of database models.

Working on Data Modeling at Different Levels:

  • UML class diagram
    • You can create a logical model using a UML class diagram to visually create or inspect classes, interfaces, attributes, operations, associations, inheritance relationships, and implementation relations and transform it to an Offline or Online Database definitions later.
    • See this tutorial for how-to.
    • You usually do logical modeling using a UML class model in the following steps:
      1. Preparing a class model diagram Environment
      2. Creating a Class Model Diagram
      3. Enhancing the Class Model
      4. Transform the Class Model into a Database Model
  • Database diagram
    • You can follow [4, 5] to create new database diagram.
    • You can also drag tables, views, materialized views, synonyms, and sequences from a database schema onto a database diagram, where they become accessible as offline database objects.
  • Offline Database
    • You can create new offline database objects, or capture them from a connection to a live database. After you have finished working with them, you can generate new and updated database definitions to online database schemas or to SQL scripts.
    • You can follow the instructions in [4, 5] to create new offline database objects. When you create an offline database, you choose the database emulation (for example, Oracle11g Database Release 1) the offline database should have.
    • You can also copy offline database objects to a project. In general, it is a good idea to make sure that the offline database uses the same database emulation as the source database.
    • Note that generation to a database is not certified against non-Oracle databases.

Notes


  1. Prior to SXML migration, these were referred to as xdf (extension) files.

References

  1. http://susanduncan.blogspot.com/
  2. Database Development with JDeveloper
  3. Metadata SXML Comparison Tool
  4. Database Development with JDeveloper

Sunday, May 15, 2011

Diagnosing Java.lang.OutOfMemoryError

The heap is one of the foremost components that should be monitored to trace performance issues[18, 19,22]. Heap pressure is created when the heap usage approaches the maximum heap size permitted. This leads to frequent full garbage collection events. This steals CPU cycles available for processing and the overall response times degrade. Extreme cases can lead to OutOfMemory conditions, which are not recoverable without a JVM restart.

OutOfMemoryError

When I ran my application, the following exceptions have been thrown in sequence:
  • java.lang.OutOfMemoryError: GC overhead limit exceeded[7,9,15]
  • java.lang.OutOfMemoryError: Java heap space
The first message means that, for some reason, the garbage collector is taking an excessive amount of time and recovers very little memory in each run. After I removed the following statement:
  • System.gc();
The 1st message was gone. However, the system threw the 2nd message. So, obviously my heap space issue remains. Here are the steps that I took to investigate it:
  1. Add the following Java Options
    • -Xloggc:gc.log -XX:+PrintGCDetails -XX:+PrintGCTimeStamps
      • System will generate a gc.log file
    • -XX:+HeapDumpOnOutOfMemoryError
      • System will generate a heap dump file
      • There is an additional HotSpot VM command line option that allows a user to specify a path where the heap dump will be placed
        • -XX:HeapDumpPath=
  2. Analyze the log files:
    • Use regular text editor to examine gc.log file
    • Use Eclipse Memory Analyzer to examine heap dump file (i.e., java_xxx.hprof)
    Sometimes your Java process could have run into  "GC overhead limit exceeded" and remain alive.  In this case, you may gather extra information using jstat:
    jstat -gcutil
    jstat -gccapacity
    without restarting the Java process.  Note that all command options discussed in this article applied to Hotspot VM.

    JVM Options

    The command line options specify:
    • -XX:+PrintGCDetails
      • prints more details at garbage collection.
    • -XX:+PrintGCTimeStamps
      • prints a time stamp representing the number of seconds since the HotSpot VM was launched until the garbage collection occurred.
    • -Xloggc:gc.log
      • causes information about the heap and garbage collection to be printed at each collection.

    To set Java Options in JDeveloper, do the following:
    1. Right select your project (i.e., ViewController) and bring up the context menu
    2. Select Project Properties...
    3. Select Run/Debug/Profile
    4. Select your Run Configuration (i.e., Default)
    5. Click Edit button
    6. Specify -Xloggc:gc.log -XX:-PrintGCDetails in the Java Options field
    Run your application and reproduce the out-of-memory exception. A log file named gc.log will be generated. I've found mine in the following default location:
    • .../system11.1.1.5.37.60.13/DefaultDomain
    because my web application was deployed to the Integrated WLS[4] and run from DefaultDomain. To understand the format of gc.log, read [5,15] for details.

    However, gc.log file was not really helpful because it simply pointed out there was a heap issue. But, it didn't say where.

    The next step I have taken is running my server with the following flag:

    -XX:+HeapDumpOnOutOfMemoryError

    it generated a java_pid30835.hprof file when my server encountered a heap error.

    Eclipse Memory Analyzer

    The heap dump file (i.e., java_pid30835.hprof) is generated by HPROF—a heap and cpu profiling tool. My heap dump file was generated in binary format. Therefore I need to use Eclpse Memory Analyzer to examine it.

    You can install Eclipse MAT via the Eclipse Update manager . Select "General Purpose Tools " and install "Memory Analyser (Incubation)" and "Memory Analyser (Charts)".
    After installation, double-click your heap dump file and select "Leak Suspects Report".
    Eclipse MAT will show a diagram:
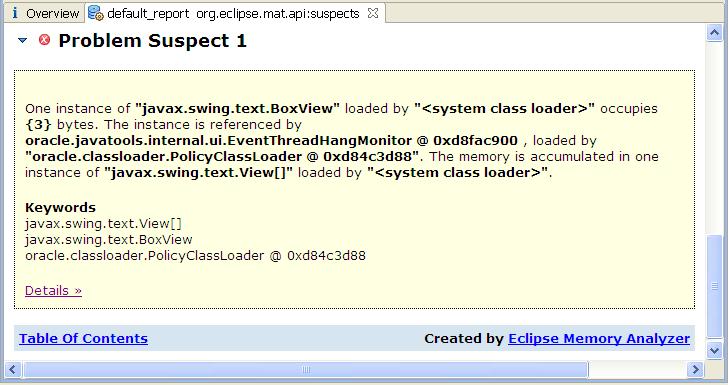
    and problem suspects:
    You can click on the "Details" link to investigate.

    Heap Size Adjustment

    If you observe many full GCs, try to determine if your old generation is sized too small to hold all the live objects collected from the Survivor and Eden spaces. Alternatively, there may be too many live objects that do not fit into the configured heap size. If it is the latter, increase the overall heap size.

    Based on whether the old generation space or the permanent generation space is running out of memory, you may adjust the sizes of heap and meta spaces in this way[10]:
    • For old generation space OutOfMemoryErrors
      • Increase -Xms and -Xmx
    • For permanent generation OutOfMemoryErrors
      • Increase -XX:PermSize and -XX:MaxPermSize

    References
    1. Eclipse Update Manager
    2. Eclipse Memory Analyzer
    3. Java Hotspot VM Options
    4. Integrated WebLogic Server (WLS)
    5. Diagnosing a Garbage Collection problem
    6. Frequently Asked Questions about Garbage Collection
    7. GC Overhead Limit Exceeded
    8. HPROF: A Heap/CPU Profiling Tool in J2SE 5.0
    9. Java SE 6 HotSpot[tm] Virtual Machine Garbage Collection Tuning
    10. Java Performance by Charlie Hunt and Binu John
    11. Understanding Garbage Collection
    12. Java HotSpot VM Options
    13. GCViewer (a free open source tool)
    14. Understanding Garbage Collector Output of Hotspot VM
    15. A Case Study of java.lang.OutOfMemoryError: GC overhead limit exceeded
    16. Memory Analyzer Downloads
      • The stand-alone Memory Analyzer is based on Eclipse RCP.
      • Can find the update site here too.
    17. Shallow vs. Retained Heap (MAT)
    18. Diagnosing Heap Stress in HotSpot (XML and More)
    19. Diagnosing OutOfMemoryError or Memory Leaks in JRockit (XML and More)
    20. MAT Documentation
    21. Out of Memory Error while Running the Memory Analyzer
      • I need to modify -Xmx512m to -Xmx4g in the file eclipse.ini to analyze a 2GB hprof file.
    22. Eclipse MAT: Querying Heap Objects Using OQL (Xml and More)
    23. Eclipse MAT: Understand Incoming and Outgoing References  (Xml and More)
    24. Memory Mapped File and IO in Java
      • Memory used to load Memory mapped file is outside of Java heap Space.  If OOM is caused by memory-mapped files, you may want to reduce your Java heap allocation (i.e., reducing -Xmx).
        • java.io.IOException: Map failed
    25. jstat - Java Virtual Machine Statistics Monitoring Tool (XML and More)
    26. Eclipse MAT — Incoming, Outgoing References (good)

    Friday, December 18, 2009

    Three SQL Modes in Oracle ADF

    There are three SQL modes in Oracle ADF:
    1. Declarative SQL mode
    2. Normal SQL mode
    3. Expert SQL mode
    where declarative SQL mode is a new addition in Oracle ADF 11g. The declarative SQL mode for view objects lets you create SQL-Independent view objects . You can define query filter predicates by using view object attribute names without having to type in SQL yourself. At runtime, Oracle ADF translates the logical filter expressions into the appropriate SQL automatically.

    Declarative SQL mode selection is supported in JDeveloper as a setting that you can apply either to the entire data model project or to individual view objects that you create. After you enable declarative SQL mode, the basic procedure to create a view object is the same as you would follow to create any entity-based view object.

    When you create a new view object, keep the default setting Updatable access through entity objects enabled to indicate that you want this view object to manage data with its base entity object. Any other choice for the data selection will disable declarative SQL mode in the Create View Object wizard.

    The alternatives to declarative SQL mode are normal mode and expert mode. When you work in either of those modes, the view object definitions you create at design time always contain the entire SQL statement based on the SQL flavor required by your application module's defined database connection. Thus the capability of SQL independence does not apply to view objects that you create in normal or expert mode. For view objects created in normal or expert mode, you must edit the WHERE clause to filter the data as required.
    In declarative SQL mode, the view object's metadata causes the ADF Business Components runtime to generate the SQL query statements as follows:
    • Generates SELECT and FROM lists based on the rendered web page's databound UI components' usage of one or more entity objects' attributes
    • Optionally, generates a WHERE clause based on a view criteria that you add to the view object definition
    • Optionally, generates an ORDERBY clause based on a sort criteria that you add to the view object definition.
    • Optionally, augments the WHERE clause to support table joins based on named view criteria that you add to the view object definition
    • Optionally, augments the WHERE clause to support master-detail view filtering based on a view criteria that you add to either the source or destination of a view link definition

    Enable Declarative SQL Mode Globally

    You can enable declarative SQL mode as a global preference so that it is the Create View Object wizard's default mode. If you did not select Enable declarative SQL mode for new objects, in the Preferences dialog, the wizard displays the default query mode, Normal.
    Typically, when you define a declarative SQL mode view object, the attributes that get queried at runtime will be determined by the requirements of the databound UI component as it is rendered in the web page. This is the runtime-generation capability that makes view objects independent of the design time database's SQL flavor. However, you may also need to execute the view object programmatically without exposing it to an ADF data binding in the UI. In this case, you can enable the Include all attributes in runtime-generated query option to ensure that a programmatically executed view object has access to all of the entity attributes.

    To enable both options (i..e, "Enable declarative SQL mode for new objects" and "Include all attributes in runtime-generated query") for the entire data model project. Go to:

    • Tools > Preferences > Business Components > View Objects

    Enable Declarative SQL Mode per View Object

    To enable Declarative SQL Mode per view object, select the View Object you want to edit. Choose Query tab and click on edit icon (i.e., pencil). On Edit Query dialog, you can choose Declarative SQL Mode (vs. Normal or Expert Mode).

    Comparisons of Three SQL Modes

    • Normal Mode
      • You can manually enter custom WHERE and ORDER BY clauses in a view object query. However, by default, the FROM clause and SELECT list are automatically derived. When you require full control over the SELECT or FROM clause in a query, you can enable expert mode.
      • The automatic cooperation of a view object with its underlying entity objects depends on correct attribute-mapping metadata saved in the XML component definition. This information relates the view object attributes to corresponding attributes from participating entity usages. JDeveloper maintains this attribute mapping information in a fully automatic way for normal entity-based view objects.
    • Expert Mode
      • In Expert Mode, you are given full control over the entire SQL statement. However, it provides limited Attribute Mapping Assistance.
      • When you enable expert mode, the read-only Generated Statement section of the Query page becomes a fully editable Query Statement text box, displaying the full SQL statement. Using this text box, you can change every aspect of the SQL query.
    • Declarative SQL Mode
      • The view object in declarative SQL mode generates all SQL clauses entirely at runtime. The runtime-generated SQL statements will be determined by the SQL flavor specified in the Business Components page of the Project Properties dialog. Currently, the runtime supports SQL92 (ANSI) style and Oracle style flavors.
      • In declarative SQL mode, since the wizard and editor do not allow you to enter WHERE and ORDERBY clauses, you provide equivalent functionality by defining a view criteria and sort criteria respectively.
        • In declarative SQL mode, view criteria and sort criteria appear in the view object metadata definition and will be converted at runtime to their corresponding SQL clause.
        • In this mode, Query Clauses section changes to show declarative controls for the Where filter expression and the Order By attribute list.
      • Just as with normal mode view objects, you can link view objects that you create in declarative SQL mode to other view objects to form master-detail hierarchies of any complexity. However, in the case of view objects that you create in declarative SQL mode, you can further refine the view object results in the Source SQL or Destination SQL dialog for the view link by selecting a previously defined view criteria in the Create View Link wizard or the overview editor for the view link.

    More Readings

    Tuesday, October 6, 2009

    Testing ADF BC Services Protected by HTTP Basic Authentication

    Using Oracle JDeveloper 11g and Oracle Application Development Framework (ADF) in tandem, you can implement business services and publish them as SOAP web services using a declarative and component-based approach.

    ADF supports open industry standards for ensuring the integrity and privacy of communications and to ensure that only authorized users can access resources in an ADF BC service. It uses the underlying Oracle Platform Security Services (OPSS) as building blocks for its security services.

    To secure your ADF BC services with HTTP basic authentication scheme, it's straightforward. You simply attach the following security policy:
    • oracle/wss_http_token_service_policy
    to your ADF BC services. The wss_http_token_service_policy uses the credentials in the HTTP header to authenticate users against the OPSS identity store.

    Testing ADF BC Services Using HTTP Analyzer

    To test ADF BC services protected by HTTP basic authentication scheme, you can use built-in HTTP Analyzer provided in JDeveloper as follows:
    • In the Application Navigator, right-click the AppModuleServiceImpl.java in the serviceInterface folder and select Run.
    • Select Target URL (i.e., http://localhost:7101/EmployeeWS-Model-context-root/AppModuleService) in the Running:DefaultServer Log window and click on it.
    • HTTP Analyzer will be started as shown in the figure.


    In our example, we'll use getEmp1() operation which requires a single input (i.e, Employee ID). To provide basic credentials, you can do:
    • Expand Request HTTP Headers and select one of the existing header (e.g., "Content-Type") and click on "+" button.
    • In the Name field, enter "Authorization".
    • In the Value field, enter "Basic weblogic:weblogic1".


    Note that basic-credentials is Base64 encoded. However, HTTP Analyzer does the base64-encoding of "username:password" automatically for you. You can see the value field changes to:
    • Basic d2VibG9naWM6d2VibG9naWMx
    if you shift the focus away from Authorization header by clicking on other headers.

    Testing ADF BC Services Using Test Page

    You can also use Web Service Test Page to test your secured ADF BC service:
    • Enter your service's URL (i.e., http://ap6029fses:7102/RestNoSecWS-Model-context-root/AppModuleService) to any browser's address field.
    • Expand Show Transport Info.
    • Enable Http Authentication and provide user name and password as shown in the diagram.


    Testing ADF BC Services Using XMLHttpRequest

    Finally, you can write a test client written in JavaScript using XMLHttpRequest. XMLHttpRequest object is based on W3C's specification and defines an API that provides scripted client functionality for transferring data between a client and a server.

    A sample JavaScript snippet which provides basic-credentials is shown below:
    var userName =  form.form_user.value;
    var password =  form.form_password.value;
    var xmlHttpReq = false;
    if (window.XMLHttpRequest) {
    xmlHttpReq = new XMLHttpRequest();
    } else if (window.ActiveXObject) {
    xmlHttpReq = new ActiveXObject("Microsoft.XMLHTTP");
    }
    xmlHttpReq.open("POST",
    "http://ap6029fses:7102/RestNoSecWS-Model-context-root/AppModuleService",
    false, userName, password);
    xmlHttpReq.setRequestHeader("Content-Type", "application/x-www-form-urlencoded");
    xmlHttpReq.send("");

    © Travel for Life Guide. All Rights Reserved.

    Analytical Insights on Health, Culture, and Security.