
OutOfMemoryError
When I ran my application, the following exceptions have been thrown in sequence:
- java.lang.OutOfMemoryError: GC overhead limit exceeded[7,9,15]
- java.lang.OutOfMemoryError: Java heap space
- System.gc();
- Add the following Java Options
- -Xloggc:gc.log -XX:+PrintGCDetails -XX:+PrintGCTimeStamps
- System will generate a
gc.logfile
- System will generate a
- -XX:+HeapDumpOnOutOfMemoryError
- System will generate a heap dump file
- There is an additional HotSpot VM command line option that allows a user to specify a path where the heap dump will be placed
- -XX:HeapDumpPath=
- -Xloggc:gc.log -XX:+PrintGCDetails -XX:+PrintGCTimeStamps
- Analyze the log files:
- Use regular text editor to examine
gc.logfile - Use Eclipse Memory Analyzer to examine heap dump file (i.e., java_xxx.hprof)
- Use regular text editor to examine
jstat -gcutil
jstat -gccapacity
without restarting the Java process. Note that all command options discussed in this article applied to Hotspot VM.
JVM Options
The command line options specify:
To set
 Run your application and reproduce the out-of-memory exception. A log file named
However,
The next step I have taken is running my server with the following flag:
-XX:+HeapDumpOnOutOfMemoryError
it generated a
Eclipse Memory Analyzer
The heap dump file (i.e.,
You can install Eclipse MAT via the Eclipse Update manager . Select "General Purpose Tools " and install "Memory Analyser (Incubation)" and "Memory Analyser (Charts)".
 After installation, double-click your heap dump file and select "Leak Suspects Report".
 Eclipse MAT will show a diagram:
 and problem suspects:
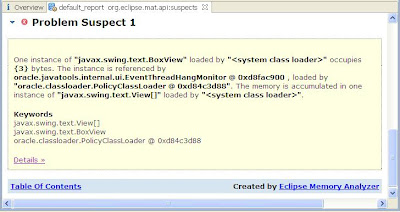 You can click on the "Details" link to investigate.
Heap Size Adjustment
If you observe many full GCs, try to determine if your old generation is sized too small to hold all the live objects collected from the Survivor and Eden spaces. Alternatively, there may be too many live objects that do not fit into the configured heap size. If it is the latter, increase the overall heap size.
Based on whether the old generation space or the permanent generation space is running out of memory, you may adjust the sizes of heap and meta spaces in this way[10]:
References
JVM Options
The command line options specify:
-XX:+PrintGCDetails- prints more details at garbage collection.
-XX:+PrintGCTimeStamps- prints a time stamp representing the number of seconds since the HotSpot VM was launched until the garbage collection occurred.
-Xloggc:gc.log- causes information about the heap and garbage collection to be printed at each collection.
To set
Java Options in JDeveloper, do the following:- Right select your project (i.e.,
ViewController) and bring up the context menu - Select Project Properties...
- Select Run/Debug/Profile
- Select your Run Configuration (i.e.,
Default) - Click Edit button
- Specify
-Xloggc:gc.log -XX:-PrintGCDetailsin the Java Options field
 Run your application and reproduce the out-of-memory exception. A log file named
 gc.log will be generated. I've found mine in the following default location:- .../system11.1.1.5.37.60.13/DefaultDomain
gc.log, read [5,15] for details.However,
gc.log file was not really helpful because it simply pointed out there was a heap issue. But, it didn't say where.The next step I have taken is running my server with the following flag:
-XX:+HeapDumpOnOutOfMemoryError
it generated a
java_pid30835.hprof file when my server encountered a heap error.Eclipse Memory Analyzer
The heap dump file (i.e.,
java_pid30835.hprof) is generated by HPROF—a heap and cpu profiling tool. My heap dump file was generated in binary format. Therefore I need to use Eclpse Memory Analyzer to examine it.You can install Eclipse MAT via the Eclipse Update manager . Select "General Purpose Tools " and install "Memory Analyser (Incubation)" and "Memory Analyser (Charts)".
 After installation, double-click your heap dump file and select "Leak Suspects Report".
 Eclipse MAT will show a diagram:
 and problem suspects:
 You can click on the "Details" link to investigate.
Heap Size Adjustment
If you observe many full GCs, try to determine if your old generation is sized too small to hold all the live objects collected from the Survivor and Eden spaces. Alternatively, there may be too many live objects that do not fit into the configured heap size. If it is the latter, increase the overall heap size.
Based on whether the old generation space or the permanent generation space is running out of memory, you may adjust the sizes of heap and meta spaces in this way[10]:
- For old generation space OutOfMemoryErrors
- Increase -Xms and -Xmx
- For permanent generation OutOfMemoryErrors
- Increase -XX:PermSize and -XX:MaxPermSize
References
- Eclipse Update Manager
- Eclipse Memory Analyzer
- Java Hotspot VM Options
- Integrated WebLogic Server (WLS)
- Diagnosing a Garbage Collection problem
- Frequently Asked Questions about Garbage Collection
- GC Overhead Limit Exceeded
- HPROF: A Heap/CPU Profiling Tool in J2SE 5.0
- Java SE 6 HotSpot[tm] Virtual Machine Garbage Collection Tuning
- Java Performance by Charlie Hunt and Binu John
- Understanding Garbage Collection
- Java HotSpot VM Options
- GCViewer (a free open source tool)
- Understanding Garbage Collector Output of Hotspot VM
- A Case Study of java.lang.OutOfMemoryError: GC overhead limit exceeded
- Memory Analyzer Downloads
- The stand-alone Memory Analyzer is based on Eclipse RCP.
- Can find the update site here too.
- Shallow vs. Retained Heap (MAT)
- Diagnosing Heap Stress in HotSpot (XML and More)
- Diagnosing OutOfMemoryError or Memory Leaks in JRockit (XML and More)
- MAT Documentation
- Out of Memory Error while Running the Memory Analyzer
- I need to modify -Xmx512m to -Xmx4g in the file eclipse.ini to analyze a 2GB hprof file.
- Eclipse MAT: Querying Heap Objects Using OQL (Xml and More)
- Eclipse MAT: Understand Incoming and Outgoing References (Xml and More)
- Memory Mapped File and IO in Java
- Memory used to load Memory mapped file is outside of Java heap Space. If OOM is caused by memory-mapped files, you may want to reduce your Java heap allocation (i.e., reducing -Xmx).
- java.io.IOException: Map failed
- jstat - Java Virtual Machine Statistics Monitoring Tool (XML and More)
- Eclipse MAT — Incoming, Outgoing References (good)
3 comments:
Excellent post as usual!!! Thorough, analytic but not boring :)
Are there any advantages in using
Eclipse Memory Analyzer instead of Java VisualVM (http://sdoulger.blogspot.com/2011/03/jvisualvm-aka-java-visualvm.html)?
>Eclipse Memory Analyzer vs. Java VisualVM
I would say there is not any advantages in using MAT instead of Java VisualVM. It's just personal preference (i.e., familiarity with Eclipse).
I tend to disagree (ok I'm biased ;-) ), but the Eclipse Memory Analyzer is still (after VisualVM "copied" some features) much more feature rich and also faster for large heap dumps.
Regards,
Markus
Post a Comment