Wednesday, January 29, 2014

Oracle Database: Managing Interval Partitions

Oracle Fusion Applications use the PS_TXN table to store the intermediate processing state.[1]  In this article, we will examine how to optimize PS_TXN table when it grows.

What's Interval Partitioning


PS_TXN is an interval partitioned table.  Interval partitioning is an enhancement to range partitioning in Oracle 11g and it automatically creates time-based partitions as new data is added.[2,3]

We have found out PS_TXN is an interval partitioned table by accident.  Checking Oracle alert log (i.e., <adr_home>/diag/rdbms/ems3266/ems3266/alert/log.xml),[4] the following entry was found:
TABLE FUSION.PS_TXN: ADDED INTERVAL PARTITION SYS_P23979 (401) VALUES LESS THAN (TO_DATE(' 2014-01-28 00:00:00', 'SYYYY-MM-DD HH24:MI:SS', 'NLS_CALENDAR=GREGORIAN'))

To verify that PS_TXN is truly an interval partitioned table, you can retrieve its table definition as follows:[5]


SQL>  select dbms_metadata.get_ddl('TABLE', 'PS_TXN', 'FUSION') from dual;

CREATE TABLE "FUSION"."PS_TXN"
   ( "ID" NUMBER(20,0) NOT NULL ENABLE,
     "PARENTID" NUMBER(20,0),
     "COLLID" NUMBER(10,0),
     "CONTENT" BLOB,
     "CREATION_DATE" DATE DEFAULT SYSDATE,
     CONSTRAINT "PS_TXN_PK" PRIMARY KEY ("COLLID", "ID")  USING INDEX PCTFREE 10 INITRANS 2 MAXTRANS 255
     STORAGE(
     BUFFER_POOL DEFAULT FLASH_CACHE DEFAULT CELL_FLASH_CACHE DEFAULT)
     TABLESPACE "FUSION_TS_TX_IDX"  GLOBAL PARTITION BY HASH ("COLLID")
     (
       PARTITION "SYS_P16301" TABLESPACE "FUSION_TS_TX_IDX" ,
       PARTITION "SYS_P16302" TABLESPACE "FUSION_TS_TX_IDX" ,
       <snipped>
       PARTITION "SYS_P16364" TABLESPACE "FUSION_TS_TX_IDX" 
     )  ENABLE
   ) PCTFREE 10 PCTUSED 40 INITRANS 1 MAXTRANS 255
  STORAGE(BUFFER_POOL DEFAULT FLASH_CACHE DEFAULT CELL_FLASH_CACHE DEFAULT)
  TABLESPACE "FUSION_TS_TX_DATA"
  LOB ("CONTENT") STORE AS SECUREFILE (
    ENABLE STORAGE IN ROW CHUNK 8192
    CACHE NOLOGGING  COMPRESS MEDIUM  KEEP_DUPLICATES
    STORAGE( BUFFER_POOL DEFAULT FLASH_CACHE DEFAULT CELL_FLASH_CACHE DEFAULT))
    PARTITION BY RANGE ("CREATION_DATE") INTERVAL (NUMTODSINTERVAL(1,'DAY'))
      PARTITION "P_0"  VALUES LESS THAN (TO_DATE(' 2012-12-23 00:00:00', 'SYYYY-MM-DD HH24:MI:SS', ( 
      'NLS_CALENDAR=GREGORIAN')) SEGMENT CREATION IMMEDIATE
      PCTFREE 10 PCTUSED 40 INITRANS 1 MAXTRANS 255
      NOCOMPRESS LOGGING
      STORAGE(INITIAL 131072 NEXT 131072 MINEXTENTS 1 MAXEXTENTS 2147483645
      PCTINCREASE 0 FREELISTS 1 FREELIST GROUPS 1
      BUFFER_POOL DEFAULT FLASH_CACHE DEFAULT CELL_FLASH_CACHE DEFAULT)
      TABLESPACE "FUSION_TS_TX_DATA"
      LOB ("CONTENT") STORE AS SECUREFILE (
        TABLESPACE "FUSION_TS_TX_DATA" 
        ENABLE STORAGE IN ROW CHUNK 8192
        CACHE NOLOGGING  COMPRESS MEDIUM  KEEP_DUPLICATES
        STORAGE(INITIAL 131072 NEXT 131072 MINEXTENTS 1 MAXEXTENTS 2147483645
        PCTINCREASE 0
        BUFFER_POOL DEFAULT FLASH_CACHE DEFAULT CELL_FLASH_CACHE DEFAULT
      )
     ) 
    )

Note that only the first partition (i.e., P_0) was specified at beginning and that interval's high value (see below for explanation) is "2012-12-23 00:00:00". It also specifies that above the transition point of December 23, 2012, partitions will be created with a width of one day.

Query by Partition Name


The normal way to reference a specific partition is to use the partition (partition_name) in the query.  For example, we have found 13187 rows in our newly created partition (i.e., SYS_P23979).

$ sqlplus / as sysdba;
SQL>spool /tmp/partition.txt
SQL> select * from FUSION.PS_TXN partition (SYS_P23979);

        ID   PARENTID     COLLID
---------- ---------- ----------
CONTENT
--------------------------------------------------------------------------------
CREATION_DATE
------------------
         1         -1   20150129
ACED0005737200246F7261636C652E6A626F2E7365727665722E444253657269616C697A65722441
4D526F77E6FDC51C118C84070300034A000A6D5065727369737449644C0006746869732430740020
27-JAN-14


<snipped>

13187 rows selected.

Partitions Created Automatically


Inserting a row that has a date later than December 23, 2012 (i.e., our initial partition's high value) would raise an error with normal range partitioning. However, with interval partitioning, Oracle 11g determines the high value of the defined range partitions, called the transition point, and creates new partitions for data that is beyond that high value.

If you have a benchmark that will be run repeatedly for a long time, controlling the growth of your database is important.  To find out how many partitions were added in PS_TXN table, you can do the following:


SQL> select table_name, partition_name, partition_position, high_value from DBA_TAB_PARTITIONS where TABLE_NAME='PS_TXN';

TABLE_NAME                     PARTITION_NAME                 PARTITION_POSITION
------------------------------ ------------------------------ ------------------
HIGH_VALUE
--------------------------------------------------------------------------------
-
PS_TXN                         P_0                                             1
TO_DATE(' 2012-12-23 00:00:00', 'SYYYY-MM-DD HH24:MI:SS', 'NLS_CALENDAR=GREGORIA

PS_TXN                         SYS_P16387                                      2
TO_DATE(' 2012-12-24 00:00:00', 'SYYYY-MM-DD HH24:MI:SS', 'NLS_CALENDAR=GREGORIA

<snipped>

PS_TXN                         SYS_P23972                                    214
TO_DATE(' 2014-01-25 00:00:00', 'SYYYY-MM-DD HH24:MI:SS', 'NLS_CALENDAR=GREGORIA

PS_TXN                         SYS_P23979                                    215
TO_DATE(' 2014-01-28 00:00:00', 'SYYYY-MM-DD HH24:MI:SS', 'NLS_CALENDAR=GREGORIA


215 rows selected.

In our latest run, a system generated partition named SYS_P23979 was added and you can find it at the last row above.  Totally, there are 215 partitions found.  In other words, 214 new partitions were added since the creation of PS_TXN table.

Conclusions


Oracle Fusion Applications use the PS_TXN table to store the intermediate processing state. When there are many concurrent users, this table receives a high number of inserts and could suffer from contention issues.
  • To detect this contention issue
  • To alleviate this contention issue
    • Follow the steps outlined in note ID 1444959.1 in My Oracle Support


References

  1. How to Tune the PS_TXN Table in the FUSION Schema
  2. More Partitioning Choices
  3. Oracle Interval Partitioning Tips
  4. Location of alert log in 11g
  5. How to get Oracle create table statement in SQL*Plus
  6. Writing sqlplus output to a file
  7. Ask Tom "Interval partitioning" - Oracle
  8. Interval partitioning - Oracle FAQ
  9. How to check the Oracle database version

Saturday, January 25, 2014

Eclipse MAT: Understand Incoming and Outgoing References

In [1], we have shown how to use OQL to query String instances starting with a specified substring (i.e., our objects of interest) from a heap dump.[7,8] To determine who is creating these objects, or find out what the purpose of some structures are, an object's incoming and outgoing references become handy.

In this article, we will examine the following topics:
  • What are incoming references or outgoing references of an object?
Then look at three topics related to incoming references:
  • Garbage Collection Roots (GC Roots)
  • Path To GC Roots
  • Immediate Dominators

Outgoing references for the 1st String instance

Outgoing References


Using the following OQL statement, we have identified total 7 entries (see Figure above) as our objects of interest:
SELECT * FROM java.lang.String WHERE toString().startsWith("http://xmlns.oracle.com/apps/fnd/applcore/log/service/types")
After expanding the first entry, it shows two outgoing references:
  1. a reference to the Class instance for the String object
  2. a reference to an array of char values
Outgoing References show the actual contents of the instances, helping to find out their purpose. In our String instance, it holds two references. The memory overhead of this String instance is shown in two values: [3]
  • Shallow Heap
    • Is the memory consumed by that object alone
  • Retained Heap
    • Is the sum of shallow sizes of all objects in the retained set of that object
These sizes of String instances depends on the internal implementation of the JVM. Read [2,4] for more details.

Incoming References


To get incoming references of the first entry, choose List Objects with Incoming References from the context menu.


Now a tree structure is displayed, showing all instances with all incoming references (note the different icon highlighted in red). These references have kept the object alive and prevented it from being garbage collected.  


Incoming references for String object are from QName object whose incoming references are, in turn, from HashMap.Entry object and class WebServiceOperation object.  See [9] for more details.


Immediate Dominators


Similarly, from the context menu, you can display immediate dominators of the first entry (see Figure below). An Object X is said to dominate an Object Y if every path from the GC Root to Y must pass through X. So, immediate dominators is a very effective way to find out who is keeping a set of objects alive. For example, the immediate dominators of our first String entry in the OQL query (note that we have used "java.*|com\.sun\..*" as our filter) is:

  • oracle.j2ee.ws.server.deployment.WebServiceEndpoint

The immediate donimator of String instance is WebServieEndpoint instance

Garbage Collection Roots (GC Roots)


GC roots are objects accessible from outside the heap. GC algorithms build a tree of live objects starting from these GC roots.

The below list shows some of the GC roots: [9,10]
  • System Class
  • Thread Block
    • Objects referred to from currently active thread blocks
    • Basically all objects in active thread blocks when a GC is happening are GC roots
  • Thread
    • Active Threads
  • Java Local
    • All local variables (parameters, objects or methods in thread stacks)
  • JNI Local
    • Local variable or parameter of JNI method
  • JNI Global
    • Global JNI reference
  • Monitor Used
    • Objects used as a monitor for synchronization

Path To GC Roots


From context menu, you can also show "Path to GC Roots" of the first entry (see Figure below). Path to GC Roots shows the path to GC roots which should be found for a given object. As you can expect, its immediate dominators must also be on this path. Note that, when you display Path to GC Roots, you can specify which fields of certain classes to be ignored when finding paths. For example, we have specified that paths through Weak or Soft Reference referents to be excluded.

GC root of instance of class String is the HashMap.Entry

Live Data Set


Now we know
  • oracle.j2ee.ws.server.deployment.WebServiceEndpoint
is keeping our String instance alive. Instead of viewing Path to GC Roots, it is easier to see it the other way around. So, we have chosen to display the outgoing references of WebServiceEndpoint instance (see Figure below). As you can see, our String instance is displayed as the leaf node of the tree structure.


References

  1. Eclipse MAT: Querying Heap Objects Using OQL (Xml and More)
  2. Java memory usage of simple data structure
  3. Shallow vs. Retained Heap
  4. Create and Understand Java Heapdumps (Act 4)
  5. Diagnosing Java.lang.OutOfMemoryError (Xml and More)
  6. I Bet You Have a Memory Leak in Your Application by Nikita Salnikov-Tarnovski
    • Classloader leak is the most common leak in web applications
  7. How to analyze heap dumps
    • Leak can be induced
      • Per call (or a class of objects)
      • Per object 
  8. Diagnosing Heap Stress in HotSpot (Xml and More)
  9. Basic Concepts of Java Heap Dump Analysis with MAT (good)
  10. What are the GC roots?

Tuesday, January 14, 2014

Eclipse MAT: Querying Heap Objects Using OQL

This article is a follow-up of [1]. Here we continue to explore on how to investigate memory leaks of an application using Memory Analyzer.[2]


Querying Heap Objects (OQL)


Memory Analyzer allows you to query the heap dump[3] with custom SQL-like queries (OQL). OQL represents classes as tables, objects as rows, and fields as columns:[4]

SELECT *
FROM [ INSTANCEOF ] <class name="name">
[ WHERE <filter-expression> ]
</filter-expression></class>To open an OQL editor use the toolbar button :

For instance, we have used the following SQL statement:
select * from java.lang.String where toString().startsWith("http://xmlns.oracle.com/bpel")

to query String objects with a certain prefix (i.e., "http://xmlns.oracle.com/bpel") and calculate the total size of retained heap associated with the interested objects.  Note that you need to press red "!" button to execute the OQL.


Shallow vs. Retained Heap


As shown in the Figure, two sizes of an object are displayed in the Result area:
  • Shallow heap
  • Retained heap

Generally speaking, shallow heap of an object is its size in the heap and retained size of the same object is the amount of heap memory that will be freed when the object is garbage collected. In other words, retained heap of object X is the sum of shallow sizes of all objects in the retained set of X, the set of objects which would be removed by Garbage Collector when X is garbage collected.

As said in [6], while Shallow Heap can be interesting, the more useful metric is the Retained Heap. For example, you can benchmark retained sizes of interested objects before and after your code optimizations. Below, we will show how to compute the total retained size of our interested objects.


Exporting to CSV...


Analyzed data can be exported from the heap editor by:[5]
  • Using the toolbar export menu (you can choose between export to HTML, CSV, and TXT)

Let's say we have exported it to a CSV file named RetainedHeap.txt.

Importing CSV File into Excel


You can use Java code to parse the CSV file and compute the retained heap of interested objects. An alternative way is using Excel, which is demonstrated here.

First, you open RetainedHeap.txt and specify both comma and space as the delimiters of fields.


Then, select all "Retained Heap" fields (shown in red) and compute the Sum as shown below:


Finding Responsible Objects


To investigate your potential memory leaks, it will be important to answer the following question:
Who has kept these objects alive?
To answer that, you can use Immediate Dominators (an Object X is said to dominate an Object Y if every path from the Root to Y must pass through X) from the context menu. This query finds and aggregates all objects dominating a given set of objects on class level. It is very useful to quickly find out who is responsible for a set of objects. Using the fact that every object has just one immediate dominator (unlike multiple incoming references) the tool offers possibility to filter "uninteresting" dominators (e.g. java.* classes) and directly see the responsible application classes.

For example, if your interested objects are char arrays. The immediate dominators of all char arrays are all objects responsible for keeping the char[] alive. The result will contain most likely java.lang.String objects. If you add the skip pattern java.* , and you will see the non-JDK classes responsible for the char arrays.


Bonus OQL Example


In the above OQL example, it shows that two columns were selected:
  • toString(s.sqlObject.actualSql)
  • s.@retainedHeapSize
from oracle.jdbc.driver.T4CPreparedStatement (alias: s).  Also, a filter was added (highlighted in red):
  • .*SELECT TerritoryResource.*

Sunday, January 12, 2014

JRockit: How to Estimate the Size of Live Data Set

In [1], we have described our benchmark as having:
  • Large Live Data Set
For instance, we have estimated that its live data size is approximately 1437MB using genconpar strategy.[4] In this article, we will show how to estimate the size of live data set using another strategy genpar. As you can guess, the live data size of a benchmark could be different using different GC strategies. Basically, live data size depends on:
  • Frequency of Objects Promoted from Young Gen (or Nursery) to Old Gen
  • Frequency of Collections
which, in turn, depend on which GC strategy used.

Importance of Estimating Live Data Size


The mark-and-sweep algorithm is the basis of all commercial garbage collectors in JVMs (including JRockit) today.[2,3] Here is how it works:[2]
When the system starts running out of memory (or some other such trigger) the GC is fired. It first enumerates all the roots and then starts visiting the objects referenced by them recursively (essentially travelling the nodes in the memory graph). When it reaches an object it marks it with a special flag indicating that the object is reachable and hence not garbage. At the end of this mark phase it gets into the sweep phase. Any object in memory that is not marked by this time is garbage and the system disposes it.
As can be inferred from the above algorithm, the computational complexity of mark and sweep is both a function of the amount of live data on the heap (for mark) and the actual heap size (for sweep). If your application has a large live data set, it could be a garbage collection bottleneck. Any garbage collection algorithm could break down given too large an amount of live data. So, it's important to estimate the size of live data set in your Java applications for any performance evaluation.

How to Estimate the Live Data Size


To estimate the live data size, we have used:
  • -Xverbose:gc flag

The format of the output is as follows:
<start>-<end>: <type> <before>KB-><after>KB (<heap>KB), <time> ms, sum of pauses <pause> ms.
<start> - start time of collection (seconds since jvm start).
<type> - OC (old collection) or YC (young collection).
<end> - end time of collection (seconds since jvm start).
<before> - memory used by objects before collection (KB).
<after> - memory used by objects after collection (KB).
<heap> - size of heap after collection (KB).
<time> - total time of collection (milliseconds).
<pause> - total sum of pauses during collection (milliseconds).
To estimate live data size, we need extract lines only from OC events. For that purpose, you can do:
>grep "\[OC#" jrockit_gc.log >OC.txt
For example, you can find the following sample lines in OC.txt:

[INFO ][memory ][Sat Jan 4 09:02:11 2014][1388826131638][21454] [OC#159] 7846.525-7846.971:
OC 2095285KB->1235482KB (2097152KB), 0.446 s, sum of pauses 389.247 ms, longest pause 389.247 ms.
...
[INFO ][memory ][Sat Jan 4 10:10:55 2014][1388830255584][21454] [OC#251] 11970.727-11971.142:
OC 1849047KB->1509435KB (2097152KB), 0.415 s, sum of pauses 379.199 ms, longest pause 379.199 ms.

For better estimation, you want to consider using statistics only from the steady state. For example, our benchmark was run with following phases:
  • Ramp-up: 7800 secs
  • Steady: 4200 secs

In the above sample output, only the first and the last OC event were displayed (see the timestamp in red). Finally, live data size is estimated to be the average memory size after OC (shown in blue).

Using Excel to Compute Average


You can use Java code to parse the GC log and compute average memory size after Old Collections. An alternative way is using Excel, which is demonstrated here.

Before we start, we need to clean up data by replacing the following tokens:
"KB"
"->"
with spaces.

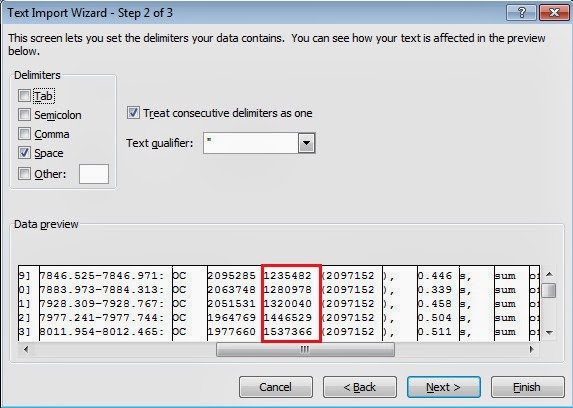
Then you open OC.txt and specify space as the delimiter for field extraction.


Select the "memory size after collection" field as shown above and compute the average as shown below:
Finally, the estimated live data size is 1359 MB.

Conclusions


If you have found that your live data set is large, you can improve your application's performance by:
  • Reducing it by improving your codes
    • For example, you should avoid object pooling which can lead both to more live data and to longer object life spans.
  • Giving your application a larger heap
    • As the complexity of a well written GC is mostly a function of the size of the live data set, and not the heap size, it is not too costly to support larger heaps for the same amount of live data. This has also the added benefit of it being harder to run into fragmentation issues and of course, implicitly, the possibility to store more live data.[3]

Finally, what size of live data set is considered large. It actually depends on what GC collector you choose. For example, if you choose JRockit Real Time as your garbage collector, practically all standard application, with live data sets up to about 30 to 50 percent of the heap size, can be successfully handled by it with pause times shorter than, or equal to, the supported service level.[3] However, if the live data size is larger than 50 percent, it could be considered too large.

References

  1. JRockit: Out-of-the-Box Behavior of Four Generational GC's (Xml and More)
  2. Back To Basics: Mark and Sweep Garbage Collection
  3. Oracle JRockit- The Definitive Guide
  4. JRockit: Parallel vs Concurrent Collectors (Xml and More)
  5. JRockit: All Posts on "Xml and More"  (Xml and More)
  6. JRockit R27.8.1 and R28.3.1 versioning 
    • Note that R28 went from R28.2.9 to R28.3.1—these are just ordinary maintenance releases, not feature releases. There is zero significance to the jump in minor version number.

Saturday, January 11, 2014

JRockit: Out-of-the-Box Behavior of Four Generational GC's

In [2], we have presented four Generational GCs in JRockit:
  • -Xgc:gencon
  • -Xgc:genpar
  • -Xgc:genconpar
  • -Xgc:genparcon
In this article, we will examine their Out-of-the-box (OOTB)[7] behaviors, especially on adaptive (or automatic) memory management in JRockit.

Adaptive Memory Management


JRockit was the first JVM to recognize that adaptive optimizations based on feedback could be applied to all subsystems in the runtime,[1] which include:
  • Code Generation
  • Memory Management
  • Threads and Synchronization

In this article, we will focus mainly on the memory management of R28. In R28, JRockit adaptively modifies many aspects of the garbage collection, but to a lesser extent than R27.[1]

Adaptive optimizations based on runtime feedback work in this way:[1] In the beginning, these changes are fairly frequent, but after a warm-up period and maintained steady-state behavior, the idea is that the JVM should settle upon an optimal algorithm. If, after a while, the steady-state behavior changes from one kind to another, the JVM may once again change strategies to a more optimal one.

So, JRockit may heuristically change garbage collection behavior at runtime, based on feedback from the memory system by doing:
  • Changing GC strategies
  • Automatic heap resizing
  • Getting rid of memory fragmentation at the right intervals
  • Recognizing when it is appropriate to "stop the world"
  • Changing the number of garbage collecting threads

-Xverbose:gc flag


To investigate the OOTB behavior of four mentioned Generational GC's (see also [2]), we have used:
  • -Xverbose:gc flag
Typically, the log shows things such as garbage collection strategy changes and heap size adjustments, as well as when a garbage collection take place and for how long.

OOTB Behavior


The OOTB behavior of four Generational GC's was investigated using one of our benchmarks, which has the following characteristics (see also [3,4]):
  • High churning rate
  • Allocating large objects

Here are the Average Response Time (ART; on relative scale) of four different GC strategies:
  • -Xgc:genpar
    • Baseline
  • -Xgc:gencon
    • -3.21%
  • -Xgc:genconpar
    • -36.56%
  • -Xgc:genparcon
    • -17.60%
After tests, it turns out that the default throughput GC (i.e., genpar) performs the best while other low-pausetimes GC's lag behind. There are a couple of reasons:
  • Large live data set
    • Our benchmark has large live data size (i.e., 1,471,425 KB) and we have assigned it a relative tight heap space (i.e., 2GB).
  • Concurrent sweeping phase cannot keep up with the workload generated from marking phase
    • This can be manifested by the following facts:
      • Emergency parallel sweep requested for both genconcon and genparcon
      • But, not genconpar

Changing GC Strategies at Runtime


The mark-and-sweep algorithm consists of two phases:[1,5,8]
  1. Mark phase
    • In which, it finds and marks all accessible objects (or live objects)
  2. Sweep phase
    • In which, it scans through the heap and reclaims all the unmarked objects
In the GC log of both gencon and genparcon, we have seen the following messages:

gencon
  • [INFO ][memory ][Thu Jan 9 06:02:12 2014][1389247332488][25536] [OC#6] Changing GC strategy from: genconcon to: genconpar, reason: Emergency parallel sweep requested.

genparcon
  • [INFO ][memory ][Wed Jan 8 21:15:00 2014][1389215700143][24163] [OC#1] Changing GC strategy from: genparcon to: genparpar, reason: Emergency parallel sweep requested.


Possible reasons could be that:
Sweeping and compaction (JRockit uses partial compaction to avoid fragmentation) tend to be more troublesome for parallelization. When you allow Java threads to be run concurrently in the sweep phase, it makes sweeping run longer and slower because more bookkeeping and/or synchronization needed. Also, using fewer GC threads introduces the issue that the garbage collector cannot keep up with the growing set of dead objects.

Conclusions


Ideally, an adaptive runtime would never need tuning at all, as the runtime feedback alone would determine how the application should behave for any given scenario at any given time. However, the computational complexity of mark-and-sweep algorithm is both a function of the amount of live data on the heap (for mark) and the actual heap size (for sweep). Depending on the amount of live data on the heap and system configuration, the OOTB behavior of chosen Generational GC's may or may not be able to keep up the garbage collections.

It is often argued that automatic memory management can slow down execution for certain applications to such an extent that it becomes impractical. This is because automatic memory management can introduce a high degree of non-determinism to a program that requires short response times. And, there are more bookkeeping or overhead. For example, it would need an Old GC to change garbage collection strategies. To avoid this, some manual tuning may be needed to get good application performance.

Before attempting to tune the performance of an application, it is important to know where the bottlenecks are. That way no unnecessary effort is spent on adding complex optimizations in places where it doesn't really matter.

References

  1. Oracle JRockit- The Definitive Guide
  2. JRockit: Parallel vs Concurrent Collectors (Xml and More)
  3. JRockit: A Case Study of Thread Local Area (TLA) Tuning (Xml and More)
  4. JRockit: Thread Local Area Size and Large Objects (Xml and More)
  5. Mark-and-Sweep Garbage Collection
  6. JRockit: All Posts on "Xml and More"
  7. The Unspoken - The Why of GC Ergonomics (Jon Masamitsu's Weblog)
  8. Mark and Sweep (MS) Algorithm (Xml and More)

Friday, January 10, 2014

JRockit: Parallel vs Concurrent Collectors

The mark and sweep algorithm is the basis of all commercial garbage collectors in JVMs today.[1,5,12] There are various implementations of mark and sweep algorithm in JRockit, which use different garbage collection strategies.

Unless you really know what you are doing, the –XgcPrio flag is the preferred way to tell JRockit what garbage collection strategies to run.[1] However, if you want further control over GC behavior, a more fine grained garbage collection strategy can be set from the command line using the –Xgc flag.

In this article, we will examine four Generational Garbage Collectors (Generational GCs) in JRockit, which uses nursery.  Note that JRockit refers to the young generations[2] as nurseries.


Generational Garbage Collection Strategies


The garbage collection strategy is defined by nursery, mark strategy and sweep strategy. The nursery  can either be present or not present. The mark and sweep phases can either be concurrent or parallel.

Here we only cover Generational GCs that use the nursery. For example, we will ignore "–Xgc:singlecon"—or single generational concurrent—in this discussion. As shown below, JRockit supports four different garbage collection strategies. They differ only in the using either concurrent or parallel in its mark and sweep phases.
-Xgc: option
Mark
Sweep
genconcon or gencon 
ConcurrentConcurrent
genconpar 
ConcurrentParallel
genparpar or genpar (default)
ParallelParallel
genparcon 
ParallelConcurrent

GC Mode


Running JRockit with –Xverbose:gc will output plenty of verbose information on what the JVM memory management system is doing. This information includes garbage collections, where they take place (nurseries or old space), changes of GC strategy, and the time a particular garbage collection takes. For example, we have specified the following options:
-Xverbose:gc -Xverbosedecorations=level,module,timestamp,millis,pid
to find the GC mode of each strategy uses. As you can see, different strategies are designed for different purposes:
  • Throughput, or
  • Low lantency (or short pausetimes)
-Xgc: option
GC Mode
genconcon or gencon 
Garbage collection optimized for short pausetimes, strategy: Generational Concurrent Mark & Sweep.

genconpar 
Garbage collection optimized for short pausetimes, strategy: Generational Concurrent Mark, Parallel Sweep.
genparpar or genpar 
Garbage collection optimized for throughput, strategy: Generational Parallel Mark & Sweep.

genparcon 
Garbage collection optimized for short pausetimes, strategy: Generational Parallel Mark, Concurrent Sweep.


Stopping the World (STW)


Stopping the world means that collectors are halting all executing Java threads to run a collection cycle, thus guaranteeing that new objects are not allocated and objects do not suddenly become unreachable while the collector is running. This has the obvious disadvantage that the application can perform no useful work while a collection cycle is running.

Even though an algorithm such as mark and sweep may run mostly in parallel, it is still a complicated problem that references may change during actual garbage collections. If the Java application is allowed to run, executing arbitrary field assignments and move instructions at the same time as the garbage collector tries to clean up the heap, synchronization between the application and the garbage collector is needed. Stopping the world for short periods of time is necessary for most garbage collectors and this is one of the main sources of latency and non-determinism in a runtime.


Parallel vs Concurrent Collectors


The mark-and-sweep algorithm consists of two phases:[5]
  1. Mark phase
    • In which, it finds and marks all accessible objects (or live objects).
    • Marking is very parallelizable and large parts of a mark phase can also be run concurrently with executing Java code.
  2. Sweep phase
    • In which, it scans through the heap and reclaims all the unmarked objects.
    • Sweeping and compaction (JRockit uses partial compaction to avoid fragmentation), however, tend to be more troublesome for parallelization, even though it is fairly simple to compact parts of the heap while others are swept, thus achieving better throughput.
Many stages of a mark and sweep garbage collection algorithm can be made to run concurrently with the executing Java application. Marking is the most critical of the stages, as it usually takes up around 90 percent of the total garbage collection time. The computational complexity of mark and sweep is both a function of the amount of live data on the heap (for mark) and the actual heap size (for sweep).

Parallel collectors require stop-the-world pause for the whole duration of major collection phases (mark or sweep), but employ all available cores to compress pause time. Parallel collectors usually have better throughput, but they are not a good fit for pause critical applications.

Concurrent collectors try to do most work concurrently (though they also do it in parallel on multi-core systems), stopping the application only for short duration. Note that the concurrent collection algorithm in JRockit is fairly different from both HotSpot's concurrent collectors (CMS[3] and G1[4] ).

Conclusions


In memory management, the time spent in GC is detrimental to an application's performance. So, minimizing the time spent in GC seems to be a good thing to achieve (or is it?). Collectors use simple stop-the-world strategy consumes less CPU time because it is simple and requires less bookkeeping. However, simple stop-the-world collectors halt all Java threads and they are not a good fit for pause critical applications.  Note that lantency is caused by not spending CPU cycle executing Java code.

Optimizing for low lantencies  is basically a matter of avoiding stopping the world and let the Java application run as much as possible. However, performing GC and executing Java code concurrently requires a lot more bookkeeping and thus, the total time spent in GC will be longer. Also, if the garbage collector gets too little total CPU time and it can't keep up with the allocation frequency, the heap will fill up and an OutOfMemoryError[6-8] will be thrown by the JVM. Therefore, another key to low latency is to keep heap usage and fragmentation at a proper level.

To conclude, the tradeoff in memory management is between maximizing throughput and maintaining low latencies. In the real world, we can't achieve both at the same time.

Wednesday, January 8, 2014

Understanding Authentication Security Providers in Oracle WebLogic

There are three main types of security providers in WebLogic Server that are involved in the authentication flow:
  • Authentication Providers
  • Identity Assertion Providers
    • A special type of Authentication provider that handles perimeter-based authentication
  • Principal Validation Providers
    • Primarily acts as a "helper" to an Authentication Provider to provide an additional protection of the Principal in a Subject
You can also configure a Realm Adapter Authentication provider that allows you to work with users and groups from previous releases of WebLogic Server.  In this article, we group them as authentication security providers.

Authentication Security Providers


WebLogic Server includes numerous authentication security providers.  Most of them work in similar fashion: given a username and password credential pair, the provider attempts to find a corresponding user in the provider's data store. These Authentication security providers differ primarily in:
  • What data store is used
    • It could be a LDAP server, a SQL database, or other data store.
  • Simple authentication vs Perimeter-based authentication[1,11]
    • Simple authentication
      • WebLogic Server establishes trust itself through usernames and passwords
    • Perimeter-based authentication
      • In perimeter authentication, a system outside of WebLogic Server establishes trust through tokens (note that a token will be usually passed through the request headers).
      • If you are using perimeter-based authentication, you need to use an Identity Assertion provider

Terminology

Before we start, let's cover some basic security concepts:
  • User
    • A user can be a person or a software entity, such as a Java client. 
    • A user with a unique identity must be defined in a security realm[6] in order to access any WebLogic resources belonging to that realm. 
    • When a user attempts to access a particular WebLogic resource, WebLogic Server tries to authenticate and authorize the user by checking the security role assigned to the user in the relevant security realm and the security policy of the particular WebLogic resource.  Note that we only focus on the authentication process in this article.
  • Group
    • Groups are logically ordered sets of users. Usually, group members have something in common.
    • Managing groups is more efficient than managing large numbers of users individually.
  • Security Realm
    • A container for the mechanisms—including users, groups, security roles, security policies, and security providers—that are used to protect WebLogic resources.
  • Principal
    • A principal is an identity assigned to a user or group as a result of authentication. Both users and groups can be used as principals by application servers. 
  • Subject
    • The Java Authentication and Authorization Service (JAAS) requires that subjects be used as containers for authentication information, including principals
    • Figure 1 illustrates the relationships between users, groups, principals, and subjects.
  • Authentication Service/Provider
    • An Authentication provider allows WebLogic Server to establish trust by validating a user. 
    • You must have one Authentication provider in a security realm, and you can configure multiple Authentication providers in a security realm.
    • Authentication service in WebLogic Server is implemented using the JAAS standard.[3]
    • JAAS implements a Java version of the Pluggable Authentication Module (PAM) framework, which permits applications to remain independent from underlying authentication technologies. 
  • Principal Validation Service/Provider
      • Primarily acts as a "helper" to an Authentication Provider to provide an additional protection of the Principal in a Subject by:
        • Signing the Principal populated by the LoginModule
        • Verifying the Principal retained in the client application code when making authorization decision.[10]
    • Identity Assertion Service/Provider
      • An Identity Assertion provider is a special type of Authentication provider that handles perimeter-based authentication and multiple security token types/protocols.
      • An Identity Assertion provider verifies the tokens and performs whatever actions are necessary to establish validity and trust in the token. 
      • Identity Assertion providers support the mapping of a valid token to a user.
      • Each Identity Assertion provider is designed to support one or more token formats.
    • LoginModule
      • A LoginModule is a required component of an Authentication provider.  It is the work-horses of authentication: all LoginModules are responsible for authenticating users within the security realm and for populating a subject with the necessary principals (users/groups). 


    Username/Password Authentication Process


    Authentication is the process of verifying an identity claimed by or for a user or system process. An authentication process consists of two steps:
    1. Identification—presenting an identifier to the security system.
    2. Verification—presenting or generating authentication information that corroborates the binding between the entity and the identifier.
    Authentication answers the question, Who are you? using credentials such as username and password combinations. An Authentication provider is used to prove the identity of users or system processes. The Authentication provider also stores, transports, and makes identity information available to various components of a system when needed. During the authentication process, a Principal Validation provider supports additional security protections for the principals (users and groups) contained within the subject, by first signing and later verifying the authenticity of those principals for each use.

    In Figure 2, we show you the basic authentication flow of simple authentication.  For the authentication flow of perimeter-based authentication, you can read [4] for details.

    When a user attempts to log into a system using a username/password combination, WebLogic Server establishes trust by validating that user's username and password, and returns a subject that is populated with principals per JAAS requirements.[3] As Figure 2 also shows, this process requires the use of a LoginModule and a Principal Validation provider.

    You can configure multiple authentication security providers in a security realm.  You can also configure the JAAS Control Flag for each Authentication provider to control how it is used in a login sequence.  Read [7] for more details.

    Finally, Oracle recommends that you also configure the Password Validation provider,[8,9] which works with several out-of-the-box authentication providers to manage and enforce password composition rules. Whenever a password is created or updated in the security realm, the corresponding authentication provider automatically invokes the Password Validation provider to ensure that the password meets the composition requirements that are established.

    References

    1. Configuring Authentication Providers—Oracle® Fusion Middleware Securing Oracle WebLogic Server 11g Release 1 (10.3.4)
    2. Principal Validation (Introduction to WebLogic Enterprise Security)
    3. JAAS Reference Guide
    4. Introduction to WebLogic Enterprise Security
    5. Oracle® Fusion Middleware Developing Security Providers for Oracle WebLogic Server 11g Release 1 (10.3.5)
    6. Security Realms
    7. Java Authentication and Authorization Service (JAAS)
    8. System Password Validation Provider: Provider Specific
    9. Password Composition Rules for the Password Validation Provider
    10. The Authorization Process
    11. The WebLogic Server security architecture supports:
      • Password-based and certificate-based authentication directly with WebLogic Server; HTTP certificate-based authentication proxied through an external Web server; perimeter-based authentication (Web server, firewall, VPN); and authentication based on multiple security token types and protocols.
    12. Understanding Login Authentication

    Wednesday, January 1, 2014

    JRockit: All Posts on "Xml and More"

    JRockit: How to Estimate the Size of Live Data Set
    -Xverbose:gc flag, Excel, JRockit Real Time, Mark-and-Sweep Algorithm

    JRockit: Out-of-the-Box Behavior of Four Generational GC's
    Adaptive Memory Management, Adaptive Optimization, JRockit R28, OOTB

    JRockit: Parallel vs Concurrent Collectors
    Garbage Collection Strategy, Generational Garbage Collector, Mark-and-Sweep Algorithm, Stopping the World, Throughput vs Low Latency, -Xgc flag, -XgcPrio flag

    JRockit: What's the Total Memory Footprint of a Java Process?
    Java Heap vs Native Memory, VSZ vs RSS

    JRockit: Analyzing GC With JRockit Verbose Output (-Xverbose:memdbg)
    GC Reason, JRockit R28, Memory Log Module,Oracle JRockit

    JRockit: A Case Study of Thread Local Area (TLA) Tuning
    -XXtlaSize, Java Performance, JRockit R28,Performance Tuning, Thread Local Area

    JRockit: Thread Local Area Size and Large Objects
    -Xverbose:memdbg, Default TLA Settings, Large Object Tuning, Performance Tuning, TLA, Tuning TLA, –XXlargeObjectLimit

    Default Values of JRockit's VM Options
    VM Options

    Diagnosing OutOfMemoryError or Memory Leaks in JRockit
    Heap Dump, Heap Histogram, hprof File, jhat,jrcmd, JRockit, JVM Option, MAT, OOM,VisualVM

    How to Debug Native OutOfMemory in JRockit
    Java Heap, JNI, jrcmd, Native Memory, Oracle JRockit, OutOfMemoryError

    java.lang.UnsupportedClassVersionError
    Backward Compatible, Class Loader, Class Loading, javac Compiler, JVM Version, Upward Compatible

    JRockit: Unable to open temporary file /mnt/hugepages/jrock8SadIG
    hugetblfs file system, JRockit, JVM, Large Pages Support, Linux Mount Command

    JRockit: Could not acquire large pages for 2Mbytes code
    Java Code, Java Heap, JRockit, Large Pages Support, Linux

    JRockit Version Information
    JDK Version, JVM Version, Mission Control Version, Oracle JRockit