Cross Column

Showing posts with label Eclipse Memory Analyzer. Show all posts

Tuesday, January 14, 2014

Eclipse MAT: Querying Heap Objects Using OQL

This article is a follow-up of [1]. Here we continue to explore on how to investigate memory leaks of an application using Memory Analyzer.[2]


Querying Heap Objects (OQL)


Memory Analyzer allows you to query the heap dump[3] with custom SQL-like queries (OQL). OQL represents classes as tables, objects as rows, and fields as columns:[4]

SELECT *
FROM [ INSTANCEOF ] <class name="name">
[ WHERE <filter-expression> ]
</filter-expression></class>To open an OQL editor use the toolbar button :

For instance, we have used the following SQL statement:
select * from java.lang.String where toString().startsWith("http://xmlns.oracle.com/bpel")

to query String objects with a certain prefix (i.e., "http://xmlns.oracle.com/bpel") and calculate the total size of retained heap associated with the interested objects.  Note that you need to press red "!" button to execute the OQL.


Shallow vs. Retained Heap


As shown in the Figure, two sizes of an object are displayed in the Result area:
  • Shallow heap
  • Retained heap

Generally speaking, shallow heap of an object is its size in the heap and retained size of the same object is the amount of heap memory that will be freed when the object is garbage collected. In other words, retained heap of object X is the sum of shallow sizes of all objects in the retained set of X, the set of objects which would be removed by Garbage Collector when X is garbage collected.

As said in [6], while Shallow Heap can be interesting, the more useful metric is the Retained Heap. For example, you can benchmark retained sizes of interested objects before and after your code optimizations. Below, we will show how to compute the total retained size of our interested objects.


Exporting to CSV...


Analyzed data can be exported from the heap editor by:[5]
  • Using the toolbar export menu (you can choose between export to HTML, CSV, and TXT)

Let's say we have exported it to a CSV file named RetainedHeap.txt.

Importing CSV File into Excel


You can use Java code to parse the CSV file and compute the retained heap of interested objects. An alternative way is using Excel, which is demonstrated here.

First, you open RetainedHeap.txt and specify both comma and space as the delimiters of fields.


Then, select all "Retained Heap" fields (shown in red) and compute the Sum as shown below:


Finding Responsible Objects


To investigate your potential memory leaks, it will be important to answer the following question:
Who has kept these objects alive?
To answer that, you can use Immediate Dominators (an Object X is said to dominate an Object Y if every path from the Root to Y must pass through X) from the context menu. This query finds and aggregates all objects dominating a given set of objects on class level. It is very useful to quickly find out who is responsible for a set of objects. Using the fact that every object has just one immediate dominator (unlike multiple incoming references) the tool offers possibility to filter "uninteresting" dominators (e.g. java.* classes) and directly see the responsible application classes.

For example, if your interested objects are char arrays. The immediate dominators of all char arrays are all objects responsible for keeping the char[] alive. The result will contain most likely java.lang.String objects. If you add the skip pattern java.* , and you will see the non-JDK classes responsible for the char arrays.


Bonus OQL Example


In the above OQL example, it shows that two columns were selected:
  • toString(s.sqlObject.actualSql)
  • s.@retainedHeapSize
from oracle.jdbc.driver.T4CPreparedStatement (alias: s).  Also, a filter was added (highlighted in red):
  • .*SELECT TerritoryResource.*

Wednesday, March 27, 2013

Analyzing the Performance Issue Caused by WebLogic Session Size Too Big

In this article, we will show you lots of interesting stuffs:
  1. How to investigate an issue with too many live objects kept in old generation, which cannot be reclaimed in Full GC by HotSpot VM
    • For background information regarding Garbage Collectors, read [1-7]
  2. How important sesssion-timeout element in web.xml is
  3. How to use java tool to generate heap dump
  4. How to use Eclipse Memory Analyzer to analyze heap dump (i.e. fod.hprof file)
    • Download link: here

The Issues


We have seen slow performance in one of our benchmarks (i.e., FOD).  Here are the symptoms:
  • GC took about 50% of the application's CPU time
  • Full GC's were not triggered by full Perm Gen, but by full Old Gen
    • The old generation is completely full and it isn't clearing up anything but a few soft references during Full GC.
So, the symptoms all point to too many live objects kept in Old Gen and they have caused many Full GC's.  There could be different causes for the above symptoms.  To investigate, you need to create heap dumps and check out what objects HotSpot VM is holding onto.  Below we will show you how to investigate this.

Generating Heap Dump


First, we have used a Java tool jmap to generate a summary of the heap contents:

$./jmap -histo 16345 >/scratch/aime1/tmp/fod.summary

 num     #instances         #bytes  class name
----------------------------------------------
   1:      15777231      822030680  [Ljava.lang.Object;
   2:       3074270      463615192  [C
   3:       4076972      331840256  [Ljava.util.HashMap$Entry;
   4:       9287101      297187232  java.util.HashMap$Entry
   5:       2105437      151591464  org.apache.myfaces.trinidad.bean.util.PropertyHashMap
   6:       4075444       97810656  java.util.HashMap$FrontCache
   7:       1893014       90864672  java.util.HashMap
   8:       2018043       80721720  org.apache.myfaces.trinidad.bean.util.FlaggedPropertyMap
   9:       3017161       72411864  java.lang.String


Unfortunately, it didn't tell us much regarding the biggest java object that have taken ~800M bytes.  But, we did notice that two other property maps also took up a lot of memory space.  So, the next step is to generate a full dump as follows:

$./jmap -dump:live,file=/scratch/aime1/tmp/fod.hprof 16345

To analyze the full heap dump, you need to use Eclipse Memory Analyzer which we have chosen the standalone version.

Analyzing Heap Dump With Memory Analyzer (MAT)


I started the Memory Analyzer with the following command:

$ cd /scratch/sguan/mat/
$ ./MemoryAnalyzer &

When I opened the heap dump file (i.e., fod.hprof), MAT failed with a message related to Java Heap Space.  So, I need to modified the following line in the MemoryAnalyzer.ini file:

-vmargs
-Xmx1024m

by changing -Xmx1024m to -Xmx6240m.  Note that how big you should set for -Xmx option depends on:
  • Size of heap dump
    • Our original file size is 6.4g and was reduced to 3.6g after loading.  Note that MAT will remove unreachable objects in the loading process.
  • Size of physical RAM in your system

The Culprit— WebLogic Session Objects


From the MAT, we have found out that the biggest live object kept in the heap was:
  • weblogic.servlet.internal.session.MemorySessionContext @ 0x705e0ff08 
Also, for two previously-mentioned property map objects, they are also related to the session object.  If you trace those objects back to the GC root, you will see that they are pointed to by the session state. They are the reason the session state is so big.

session-timeout Element in web.xml


Session object is used by WebLogic container to track a user's session that uses the StoreFrontModule web application in our FOD benchmark.  Every time a new user comes in, it starts a session. This session object keeps user's data or states in it. If the user leaves, the session is considered idle and the server will retain it in memory for a period of time before reclaiming it.

Java web applications can be configured with a session timeout value which specifies the number of minutes a session can be idle before it is abandoned.  This session timeout element is defined in the Web Application Deployment Descriptor web.xml[9]. For example, this was the session timeout value we had:

<session-config>
<session-timeout>35</session-timeout>
</session-config>

The problem with our benchmark's slowness is due to this session timeout value being too high.  This has caused the sessions being piled up and taking up lots of memory. Setting it to be a lower value (see [10] on how to patch web.xml in an EAR), our benchmark then performs normally.

Sunday, May 15, 2011

Diagnosing Java.lang.OutOfMemoryError

The heap is one of the foremost components that should be monitored to trace performance issues[18, 19,22]. Heap pressure is created when the heap usage approaches the maximum heap size permitted. This leads to frequent full garbage collection events. This steals CPU cycles available for processing and the overall response times degrade. Extreme cases can lead to OutOfMemory conditions, which are not recoverable without a JVM restart.

OutOfMemoryError

When I ran my application, the following exceptions have been thrown in sequence:
  • java.lang.OutOfMemoryError: GC overhead limit exceeded[7,9,15]
  • java.lang.OutOfMemoryError: Java heap space
The first message means that, for some reason, the garbage collector is taking an excessive amount of time and recovers very little memory in each run. After I removed the following statement:
  • System.gc();
The 1st message was gone. However, the system threw the 2nd message. So, obviously my heap space issue remains. Here are the steps that I took to investigate it:
  1. Add the following Java Options
    • -Xloggc:gc.log -XX:+PrintGCDetails -XX:+PrintGCTimeStamps
      • System will generate a gc.log file
    • -XX:+HeapDumpOnOutOfMemoryError
      • System will generate a heap dump file
      • There is an additional HotSpot VM command line option that allows a user to specify a path where the heap dump will be placed
        • -XX:HeapDumpPath=
  2. Analyze the log files:
    • Use regular text editor to examine gc.log file
    • Use Eclipse Memory Analyzer to examine heap dump file (i.e., java_xxx.hprof)
    Sometimes your Java process could have run into  "GC overhead limit exceeded" and remain alive.  In this case, you may gather extra information using jstat:
    jstat -gcutil
    jstat -gccapacity
    without restarting the Java process.  Note that all command options discussed in this article applied to Hotspot VM.

    JVM Options

    The command line options specify:
    • -XX:+PrintGCDetails
      • prints more details at garbage collection.
    • -XX:+PrintGCTimeStamps
      • prints a time stamp representing the number of seconds since the HotSpot VM was launched until the garbage collection occurred.
    • -Xloggc:gc.log
      • causes information about the heap and garbage collection to be printed at each collection.

    To set Java Options in JDeveloper, do the following:
    1. Right select your project (i.e., ViewController) and bring up the context menu
    2. Select Project Properties...
    3. Select Run/Debug/Profile
    4. Select your Run Configuration (i.e., Default)
    5. Click Edit button
    6. Specify -Xloggc:gc.log -XX:-PrintGCDetails in the Java Options field
    Run your application and reproduce the out-of-memory exception. A log file named gc.log will be generated. I've found mine in the following default location:
    • .../system11.1.1.5.37.60.13/DefaultDomain
    because my web application was deployed to the Integrated WLS[4] and run from DefaultDomain. To understand the format of gc.log, read [5,15] for details.

    However, gc.log file was not really helpful because it simply pointed out there was a heap issue. But, it didn't say where.

    The next step I have taken is running my server with the following flag:

    -XX:+HeapDumpOnOutOfMemoryError

    it generated a java_pid30835.hprof file when my server encountered a heap error.

    Eclipse Memory Analyzer

    The heap dump file (i.e., java_pid30835.hprof) is generated by HPROF—a heap and cpu profiling tool. My heap dump file was generated in binary format. Therefore I need to use Eclpse Memory Analyzer to examine it.

    You can install Eclipse MAT via the Eclipse Update manager . Select "General Purpose Tools " and install "Memory Analyser (Incubation)" and "Memory Analyser (Charts)".
    After installation, double-click your heap dump file and select "Leak Suspects Report".
    Eclipse MAT will show a diagram:
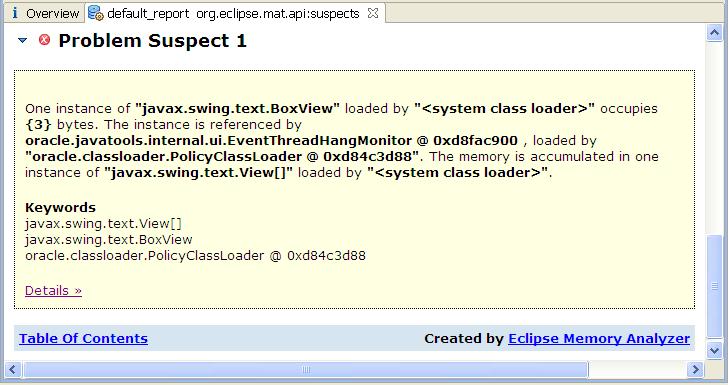
    and problem suspects:
    You can click on the "Details" link to investigate.

    Heap Size Adjustment

    If you observe many full GCs, try to determine if your old generation is sized too small to hold all the live objects collected from the Survivor and Eden spaces. Alternatively, there may be too many live objects that do not fit into the configured heap size. If it is the latter, increase the overall heap size.

    Based on whether the old generation space or the permanent generation space is running out of memory, you may adjust the sizes of heap and meta spaces in this way[10]:
    • For old generation space OutOfMemoryErrors
      • Increase -Xms and -Xmx
    • For permanent generation OutOfMemoryErrors
      • Increase -XX:PermSize and -XX:MaxPermSize

    References
    1. Eclipse Update Manager
    2. Eclipse Memory Analyzer
    3. Java Hotspot VM Options
    4. Integrated WebLogic Server (WLS)
    5. Diagnosing a Garbage Collection problem
    6. Frequently Asked Questions about Garbage Collection
    7. GC Overhead Limit Exceeded
    8. HPROF: A Heap/CPU Profiling Tool in J2SE 5.0
    9. Java SE 6 HotSpot[tm] Virtual Machine Garbage Collection Tuning
    10. Java Performance by Charlie Hunt and Binu John
    11. Understanding Garbage Collection
    12. Java HotSpot VM Options
    13. GCViewer (a free open source tool)
    14. Understanding Garbage Collector Output of Hotspot VM
    15. A Case Study of java.lang.OutOfMemoryError: GC overhead limit exceeded
    16. Memory Analyzer Downloads
      • The stand-alone Memory Analyzer is based on Eclipse RCP.
      • Can find the update site here too.
    17. Shallow vs. Retained Heap (MAT)
    18. Diagnosing Heap Stress in HotSpot (XML and More)
    19. Diagnosing OutOfMemoryError or Memory Leaks in JRockit (XML and More)
    20. MAT Documentation
    21. Out of Memory Error while Running the Memory Analyzer
      • I need to modify -Xmx512m to -Xmx4g in the file eclipse.ini to analyze a 2GB hprof file.
    22. Eclipse MAT: Querying Heap Objects Using OQL (Xml and More)
    23. Eclipse MAT: Understand Incoming and Outgoing References  (Xml and More)
    24. Memory Mapped File and IO in Java
      • Memory used to load Memory mapped file is outside of Java heap Space.  If OOM is caused by memory-mapped files, you may want to reduce your Java heap allocation (i.e., reducing -Xmx).
        • java.io.IOException: Map failed
    25. jstat - Java Virtual Machine Statistics Monitoring Tool (XML and More)
    26. Eclipse MAT — Incoming, Outgoing References (good)

    © Travel for Life Guide. All Rights Reserved.

    Analytical Insights on Health, Culture, and Security.